The question
An IoT node need not stay fully awake while waiting for a data-collection visit. This demonstration combines an addressed wake-up receiver, a UAV-carried transmitter, and a dashboard. Its figures document the system, outdoor range testing, the sensing board, and the end-to-end demonstration.
Connect sensing, flight, and the dashboard.
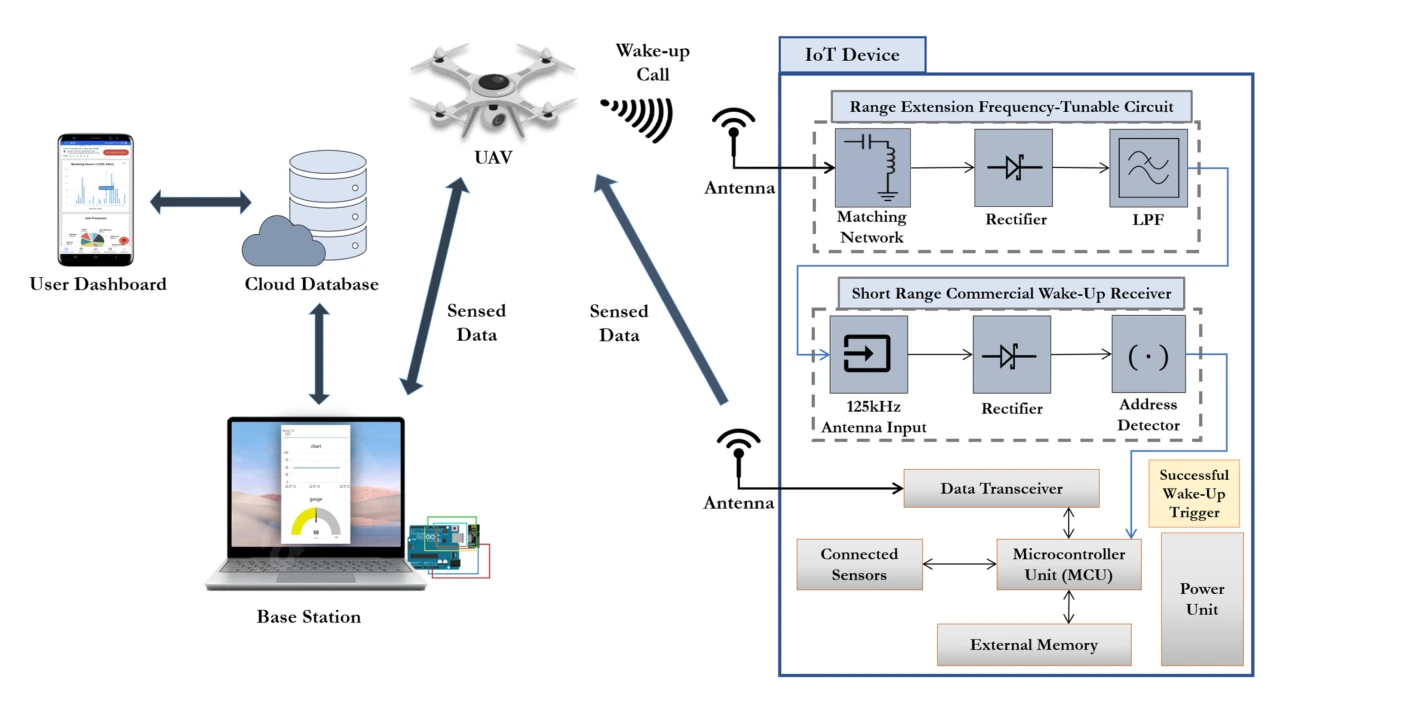
The system diagram follows the wake-up signal from the UAV to an IoT device, then follows the collected data to the base station and user interface. It also shows the hardware path used to detect an addressed wake-up call.
System path. The UAV activates a ground device through the wake-up link, then relays its measurements toward the base station and dashboard. The arrows distinguish activation from sensed-data transfer.
Receiver detail. The inset places signal conditioning and address detection before the main sensing and communication circuitry. This separation explains how the device can wait for a call without keeping its full data path active.
Take the wake-up link outdoors.
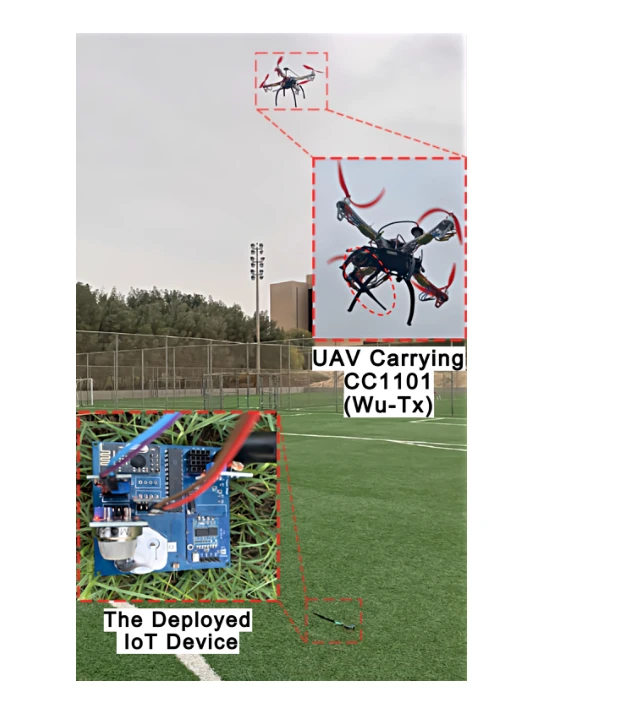
The field setup places the transmitter on a UAV and the receiving node on the ground. This makes aerial reach and alignment part of the practical system test.
Outdoor arrangement. The transmitter is carried by the UAV while the receiver is part of the ground IoT node. This places the wake-up mechanism in the geometry relevant to aerial data collection, beyond an instrument-only bench test.
What is evaluated. The experiment tests successful device wake-up as the aircraft’s position changes. The later height-versus-offset plot is needed to interpret the operating range; the setup photograph establishes where the transmitting and receiving hardware are located.
Build the sensing node.
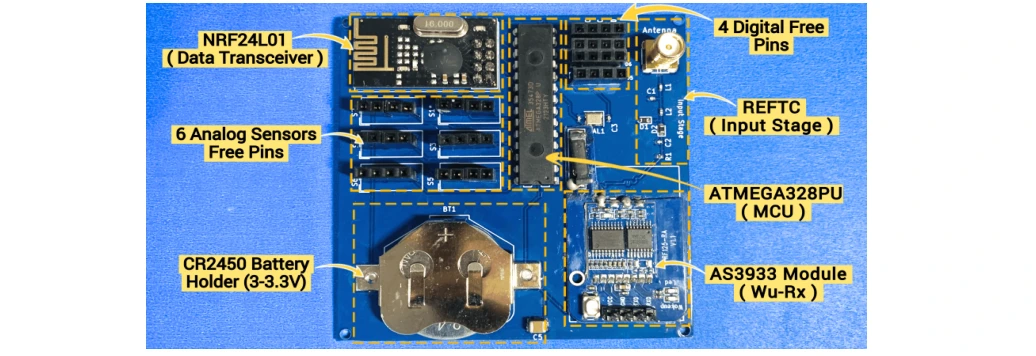
The board brings together sensors, a microcontroller, a data transceiver, and the wake-up receiver. These components allow a sleeping node to respond to a call and then transmit its measurements.
Board functions. The labeled blocks locate the microcontroller, wake-up receiver, data transceiver, battery, and sensor connections. They show the complete sensing node used in the demonstration.
Measure the effect of horizontal misalignment.
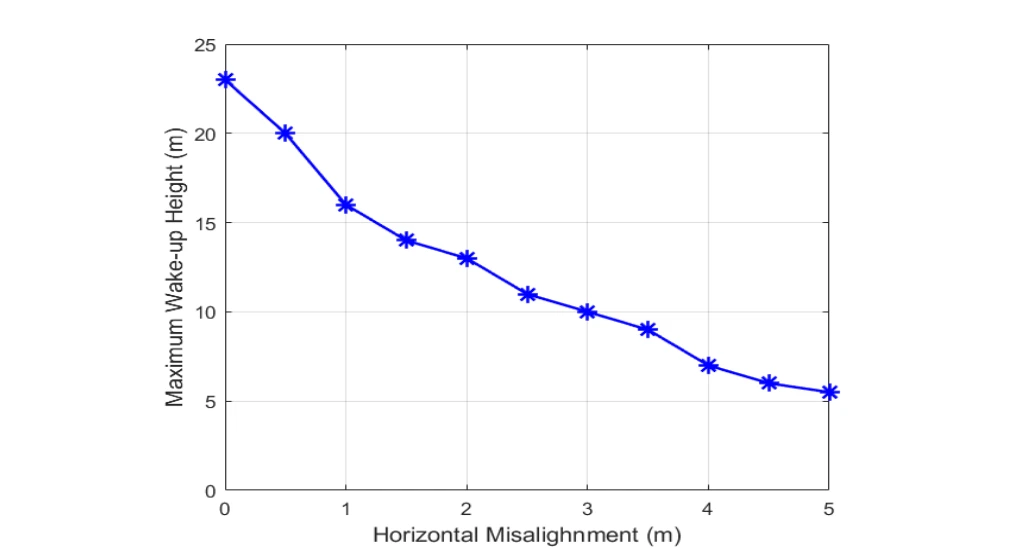
The maximum wake-up height is plotted as the UAV moves away from direct alignment with the device. The result turns a laboratory communication link into a deployment constraint.
Geometry and range. The vertical axis is the maximum successful wake-up height; the horizontal axis is sideways offset from the device. Each point describes a different link geometry, rather than flight time.
Observed trend. The tested height falls as offset increases. This distinguishes the favorable overhead case from operation farther to one side, where greater separation and antenna alignment constrain the link.
Follow a measurement through the software stack.
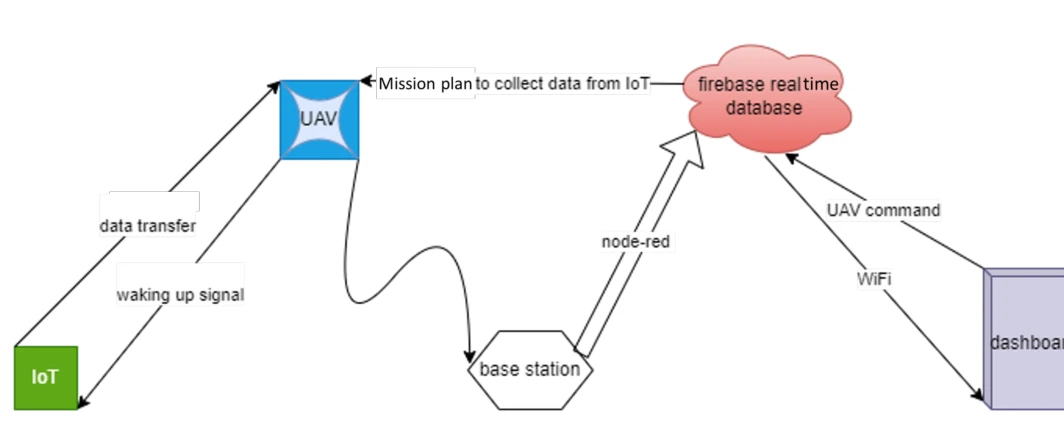
The data-flow diagram connects flight control, sensing, the base station, a cloud database, and the dashboard. It shows how the radio event becomes information visible to a user.
Measurements and commands. Measurements move through the UAV/base-station link to a Firebase database and dashboard. The command path lets the interface request an intended node, with Node-RED linking the software components.
Assemble the end-to-end demonstration.
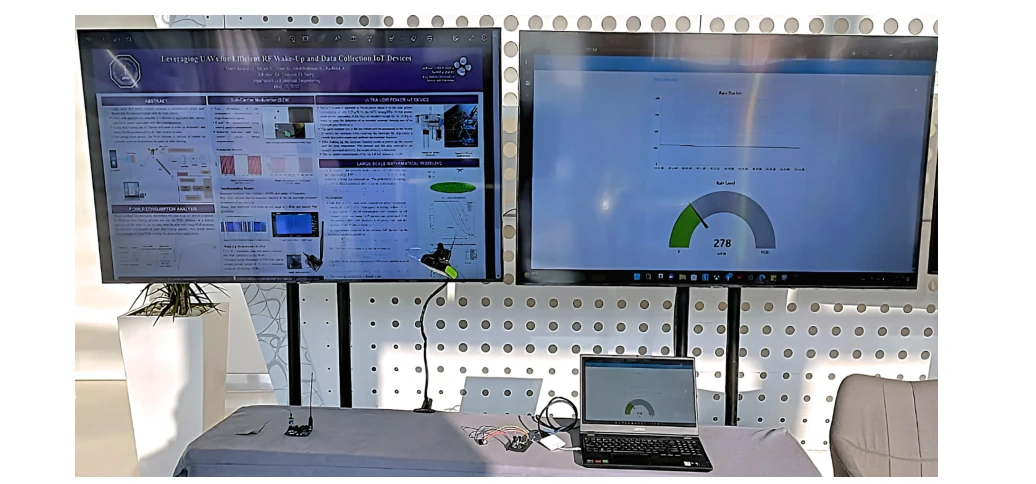
The workstation setup places monitoring and control interfaces alongside the physical electronics. This is the integration step that connects individual working components into a usable system.
Demonstration setup. The raised transmitter emulates the UAV side during an indoor demonstration. The laptop and displays show the collected data and interface, allowing the wake-up/data sequence to be inspected without flying an aircraft in the venue.
Demonstrate the wake-up transaction.
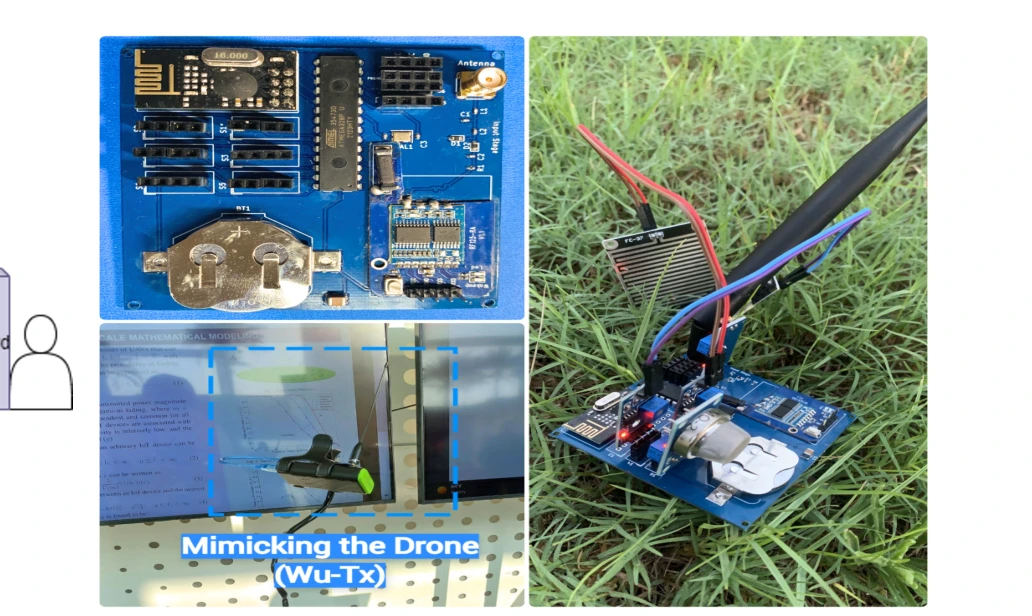
The final photographs show the IoT node and a controlled UAV-emulation setup. They document the practical activation and data-collection process used in the demo.
The sensing device. The 7 × 7 cm² IoT board combines the low-power wake-up path with the circuitry needed to acquire and transmit measurements. The board is the end device being activated, rather than a stand-in for the radio link.
The demonstration. The setup emulates the UAV-side wake-up transaction so visitors can follow activation and data collection. This makes the sequence inspectable in a demonstration setting, alongside the separate outdoor range experiments.
Putting it together
An end-to-end proof of implementation.
The demonstration establishes a complete wake-up-and-collect workflow. The later journal study expands this foundation with device engineering, reliability analysis, and large-scale network modeling.
Citation
Mohammed, A. S., Khalifa, O., Alhejab, A., Abdelrahman, A. S., Al-Radhwan, A., ElSawy, H., Kouzayha, N., Al-Harthi, N., Elmirghani, J., Hanif, M., & Al-Naffouri, T. Y. Demo Abstract: Energy-Efficient Aerial Data Aggregation in IoT Networks with WuR. IEEE International Black Sea Conference on Communications and Networking, 147-149 (2023).
BibTeX
@inproceedings{mohammed2023wur,
  title = {Demo Abstract: Energy-Efficient Aerial Data Aggregation in IoT Networks with WuR},
  author = {Mohammed, Anas S. and Khalifa, Omar and Alhejab, Ali and Abdelrahman, Abdelrahman S. and Al-Radhwan, Ahmed and ElSawy, Hesham and Kouzayha, Nour and Al-Harthi, Noha and Elmirghani, Jaafar and Hanif, Mansoor and Al-Naffouri, Tareq Y.},
  booktitle = {2023 IEEE International Black Sea Conference on Communications and Networking (BlackSeaCom)},
  pages = {147--149},
  year = {2023},
  doi = {10.1109/BlackSeaCom58138.2023.10299765}
}