The question
Keeping remote sensors awake wastes energy, but sleeping through a UAV visit loses data. This study develops an addressed wake-up-radio system, validates the hardware, and then connects the prototype to models of timing, reliability, and deployment at network scale.
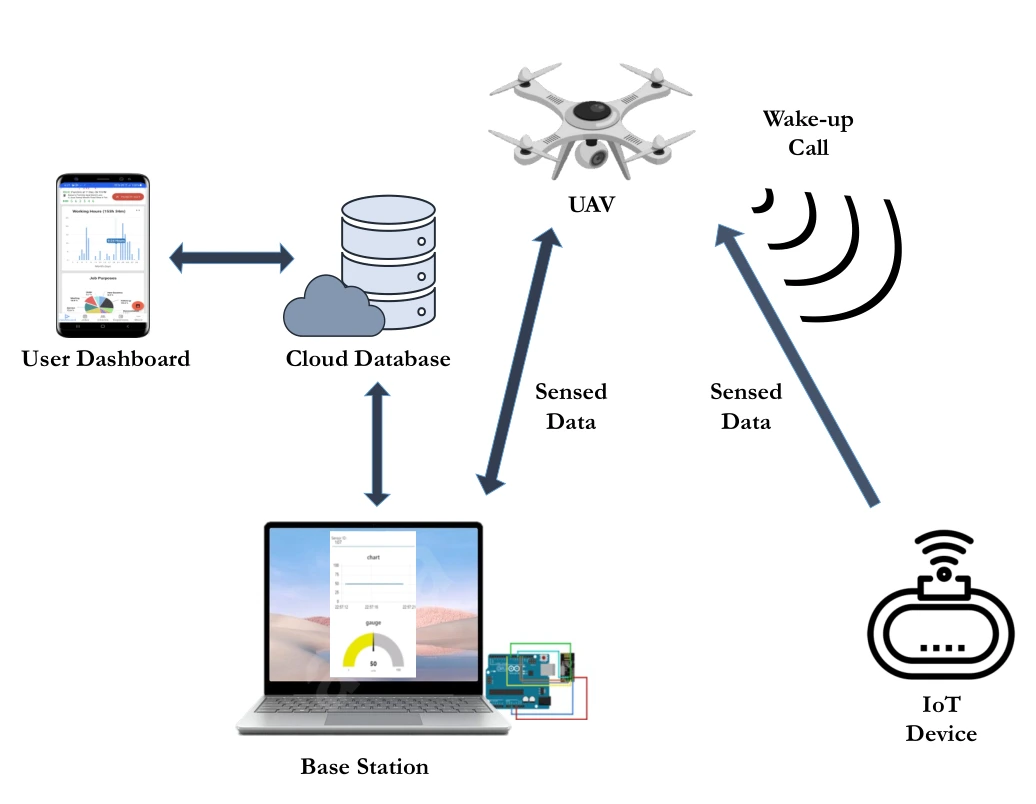
Start with the full collection system.
The architecture connects the UAV wake-up transmitter, sleeping IoT node, base station, database, and dashboard. It establishes the path that later hardware and analytical results must support.
Wake-up and data paths. The wake-up call travels from the UAV to the ground device; the sensed data travels back toward the UAV and base station. These arrows separate the low-power activation mechanism from the main data-transfer link.
Ground infrastructure. The base station organizes the collected measurements and uploads them to a cloud database. The dashboard completes the path to the user, making the figure an end-to-end system diagram rather than only a radio-link sketch.
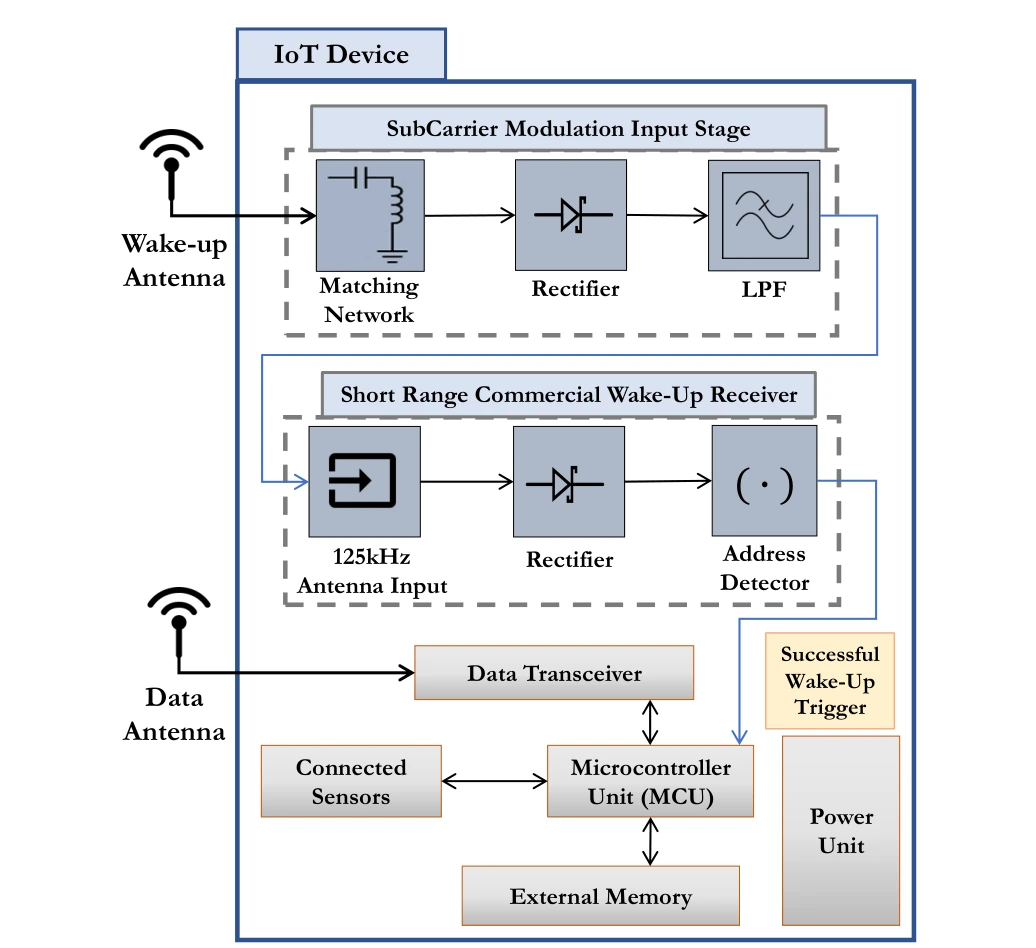
Design the low-power IoT node.
The block diagram separates wake-up detection, addressing, sensing, and data transmission. A successful wake-up event activates the functions that would otherwise consume power while the node waits.
Upper signal path. The subcarrier-modulation input stage contains matching, rectification, and filtering blocks before the commercial wake-up receiver. The receiver then detects an address and issues the wake-up signal.
Lower device blocks. The microcontroller, sensors, memory, and data transceiver perform the sensing and reporting task after activation. Separating these functions explains how the wake-up path can remain available while more power-hungry circuitry sleeps.
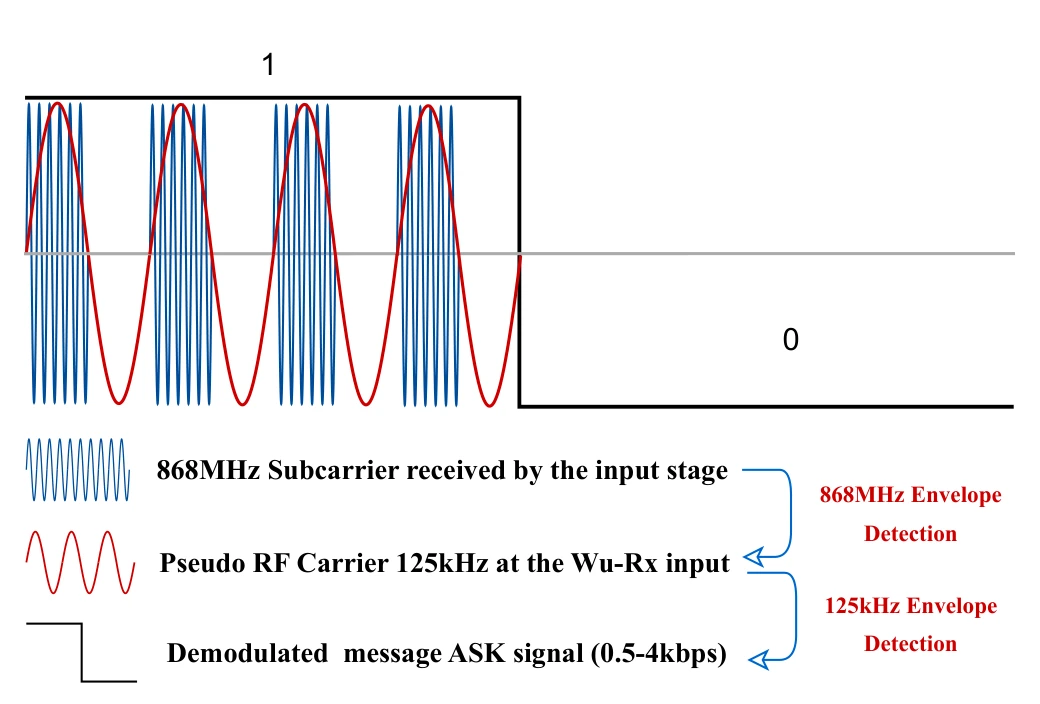
Create an addressable wake-up waveform.
Subcarrier modulation lets a higher-frequency transmitted signal deliver the lower-frequency pattern expected by the wake-up receiver. The waveform connects the radio carrier to the decoded binary message.
Carrier and envelopes. The drawing starts with an 868 MHz subcarrier and shows the lower-frequency envelope recovered from it. A subsequent detection stage exposes the on–off keyed message used by the wake-up receiver.
Reading the bit sequence. Compare the high-frequency oscillations with the slower binary envelope above them. The receiver needs the address-bearing message, rather than the original radio-frequency waveform, which motivates the passive input-stage demodulation.
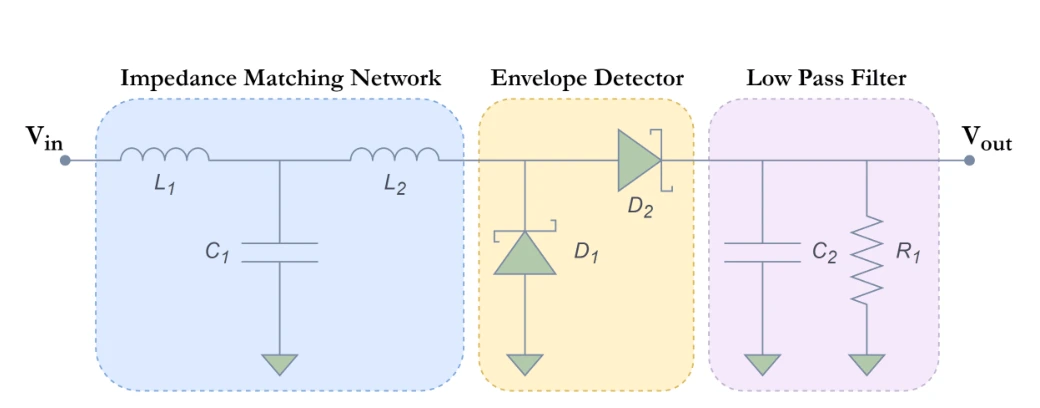
Implement the receiver input stage.
Matching, envelope detection, and low-pass filtering translate the received signal into a form the wake-up receiver can use. The schematic makes the signal-processing path explicit.
Three circuit stages. The matching network couples the antenna to the input; the envelope detector rectifies the signal; the low-pass filter retains the lower-frequency carrier needed by the wake-up receiver.
Build the transmitter and receiver hardware.
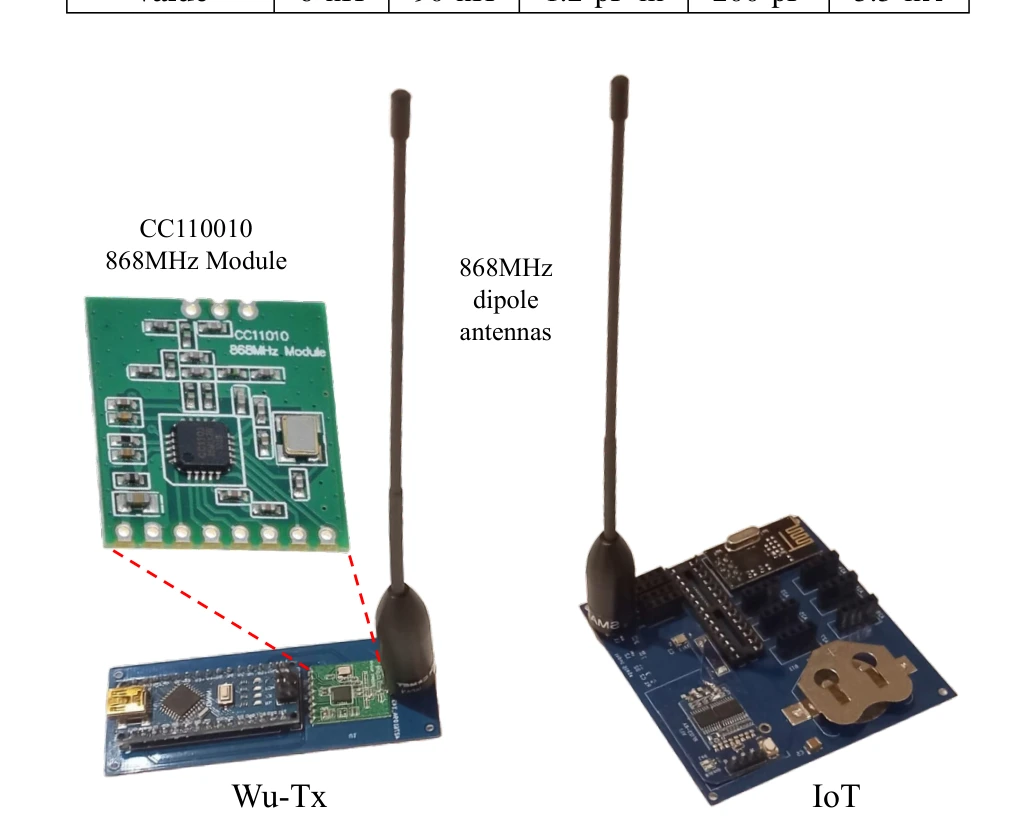
Photographs show the developed IoT device and wake-up transmitter. This step turns the earlier architecture and circuit descriptions into physical components for testing.
The transmitter. The CC1101-based wake-up transmitter and its dipole antenna implement the radio side of the wake-up call. The IoT board provides the corresponding receiver-side hardware, connecting the earlier block diagrams to assembled components.
Why both boards matter. An operational wake-up link depends on the transmitter waveform, antenna, input stage, and receiver together. The photograph documents the prototype used for the following bench, indoor, and aerial experiments; it is not a chip-level integration claim.
Make the measurements accessible.
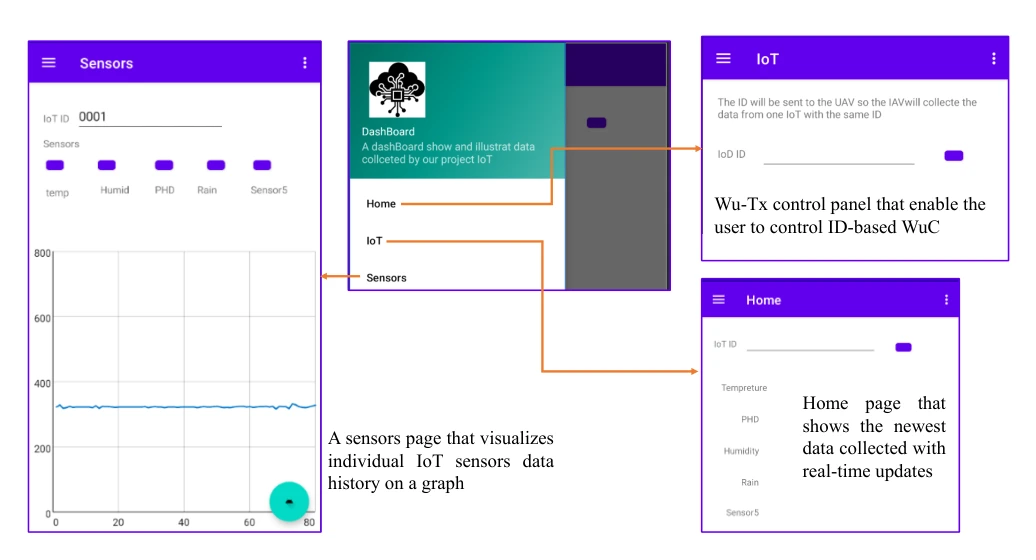
The mobile interface presents sensed data and system controls. It provides the user-facing endpoint of the otherwise hardware-centered data-collection pipeline.
Sensor view. The sensor screen displays collected measurements, completing the path from the ground node through the UAV and base station to the user.
Control and home views. The IoT control screen supports addressed wake-up requests. The remaining view provides navigation among the application’s functions, making the dashboard part of the operational system rather than only a results display.
Integrate the sensing board.
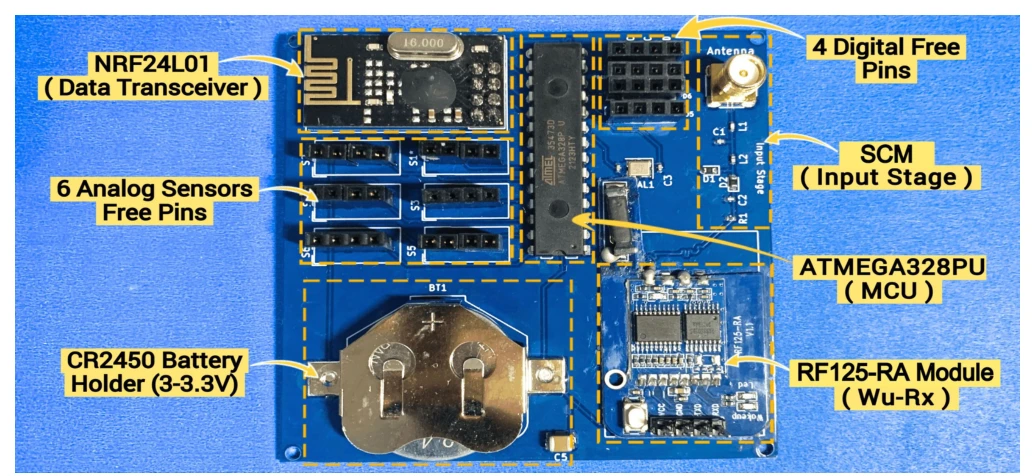
The annotated prototype identifies the microcontroller, sensor interfaces, wake-up module, power source, and data radio. The layout shows how the required functions fit on the actual device.
Hardware integration. The photograph identifies the data transceiver, microcontroller, wake-up receiver, input stage, battery holder, and free sensor pins. Their placement documents how the low-power wake-up path is integrated with a functioning sensing node.
Check the wake-up signal on the bench.
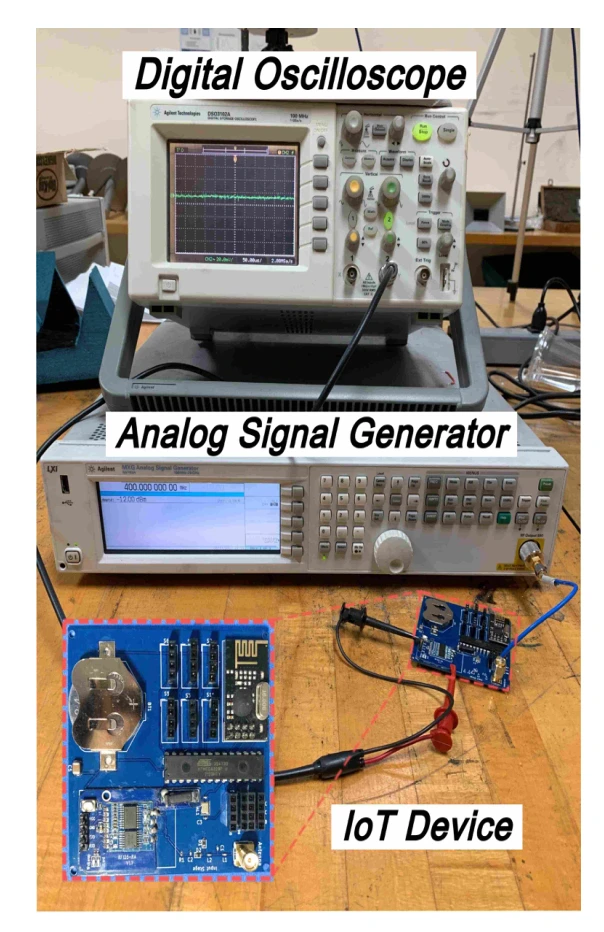
The laboratory setup uses a signal generator and oscilloscope to test subcarrier modulation with the IoT node. This isolates the receive path before outdoor deployment.
Signal source. The microwave signal generator supplies a carrier swept around the intended 868 MHz operating frequency. This isolates the subcarrier-modulation input stage before the complete wake-up protocol is tested.
Measurement. The oscilloscope observes the receiver input-stage output. With a continuous carrier and no slower modulation envelope, rectification and low-pass filtering produce an approximately DC output, so the test checks the input stage’s frequency response.
Scope of this test. This is a bench characterization of the signal-conditioning path. The separate indoor and aerial experiments are needed to establish how the complete wake-up link behaves over distance.
Inspect the transmitted wake-up call.
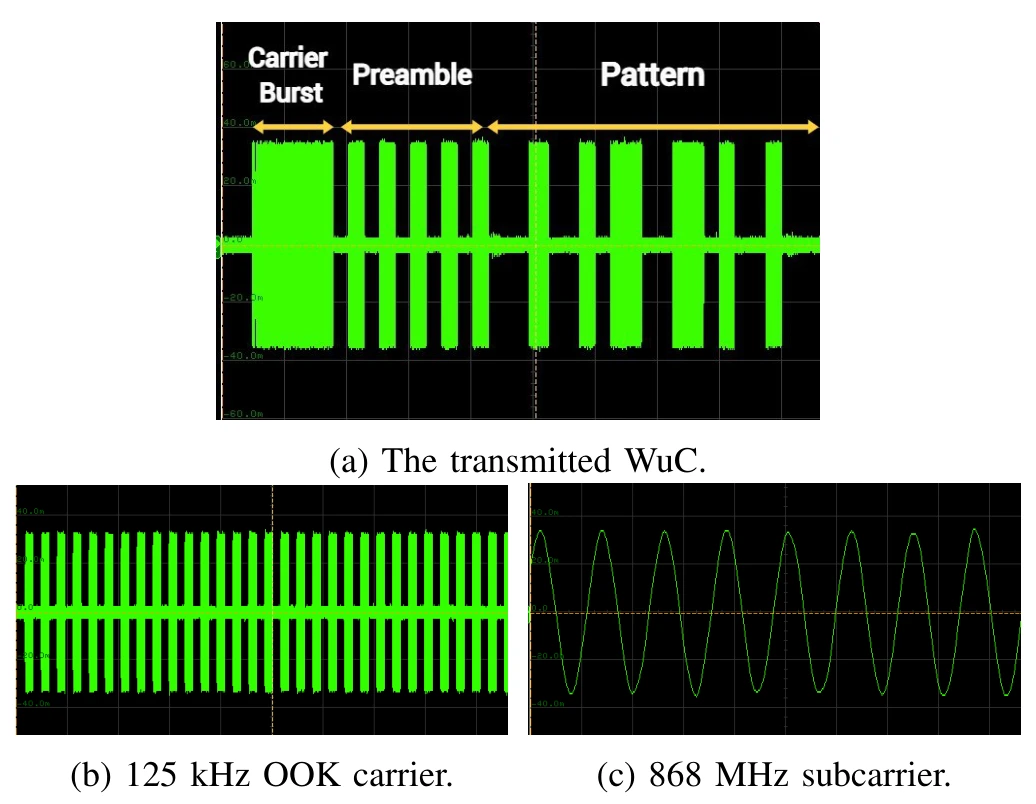
Oscilloscope traces expose the carrier burst, preamble, and address pattern. These measurements check that the transmitted signal contains the structure expected by the receiver.
Panel (a). The complete transmitted wake-up call contains the carrier burst, preamble, and address pattern. Reading these in order shows how a receiver is prepared and then given an identification-bearing message.
Panels (b) and (c). The lower panels zoom into the 125 kHz on–off keyed carrier and the 868 MHz subcarrier. They are different time scales of the same transmitted waveform, rather than two independent communication experiments.
Measure the indoor communication link.
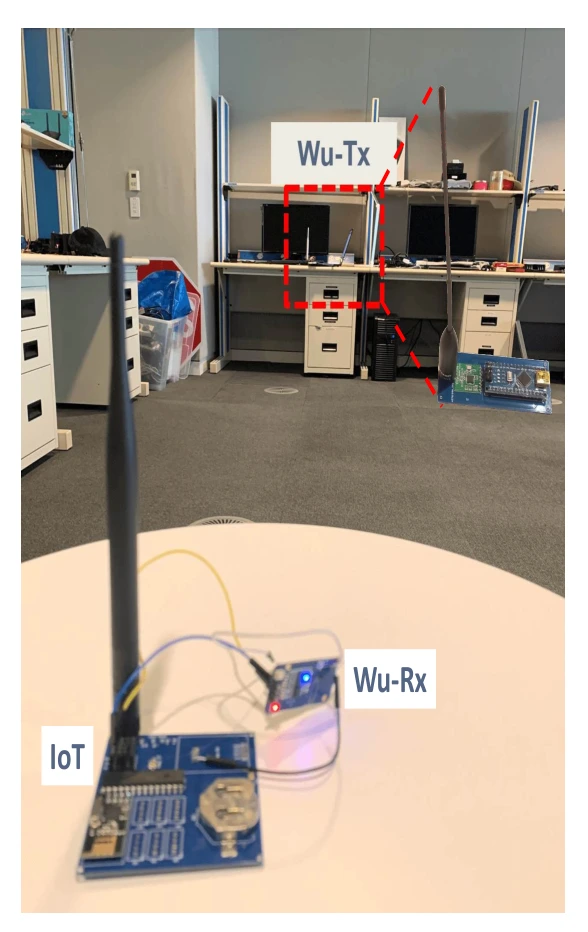
The indoor range experiment tests the transmitter and receiving node in a controlled environment. It provides a practical reference before moving to the aerial configuration.
Test arrangement. The wake-up transmitter is placed across the room from the assembled IoT device and its receiver. This checks the complete link after the input stage has been characterized on the bench.
What changes between tests. The indoor experiment changes separation between the transmitter and receiver. It precedes the aerial test, where antenna alignment and UAV motion introduce additional conditions that a room-scale stationary setup does not capture.
Reading the photograph. The labeled receiver is part of the powered IoT prototype. Successful wake-up refers to activating that device through the wake-up path, not merely observing an RF signal at an instrument input.
Move the transmitter onto a UAV.
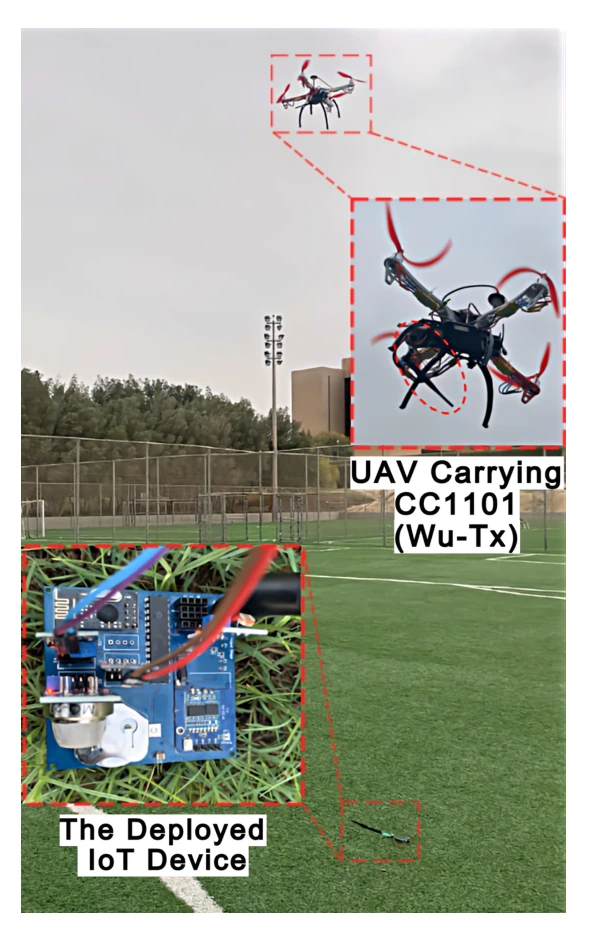
The outdoor setup combines a flying transmitter with the deployed IoT node. It tests the intended data-collection geometry rather than a fixed bench arrangement.
On the UAV. The wake-up transmitter and antenna are attached to the aircraft for outdoor measurements. The inset identifies the transmitter assembly, distinguishing the wake-up hardware from the UAV itself.
On the ground. The deployed IoT device is the target of the wake-up calls. The experiment varies height and horizontal offset to determine when the assembled device can still be activated.
From setup to result. The reported stable wake-up height reaches 23 m in the tested arrangement. The next figure shows how that reach falls with horizontal misalignment; the photograph alone should not be read as a general range specification.
Quantify aerial reach and misalignment.
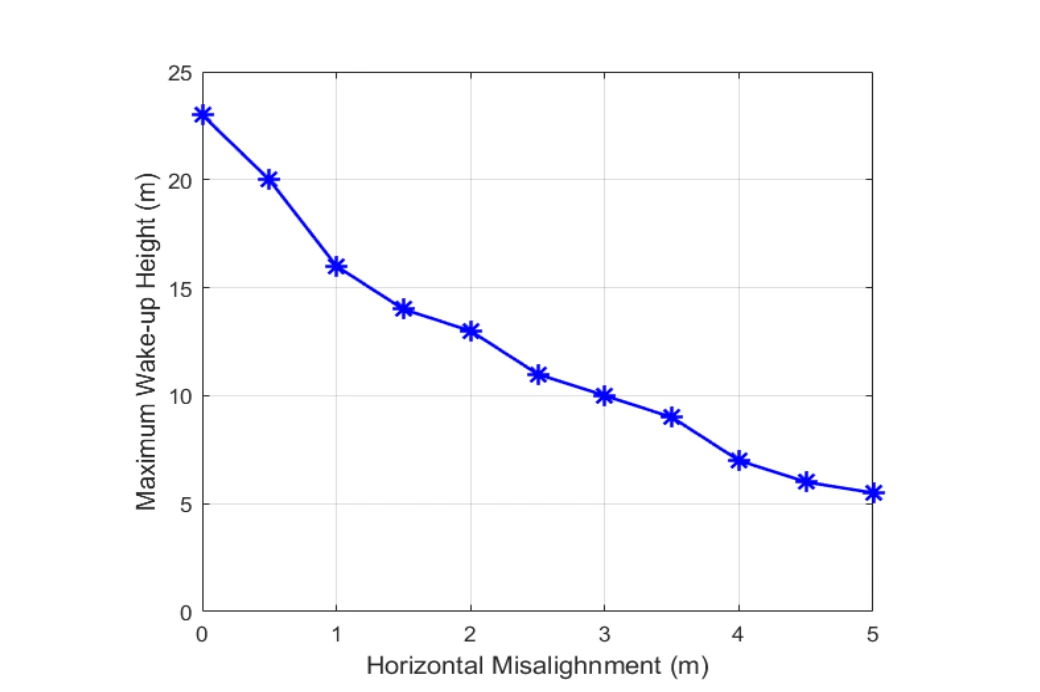
The measured wake-up height decreases as horizontal separation grows. That geometry becomes important when specifying how closely the UAV must pass a sensor.
Reading the axes. The horizontal axis is the UAV’s offset from the ground device; the vertical axis is the maximum height at which wake-up still succeeds. Each point represents a tested geometry, rather than a trajectory through time.
What the trend means. The available wake-up height drops as the UAV moves sideways. Greater separation and a less favorable line-of-sight geometry reduce the received signal, so directly overhead range cannot be assumed at every horizontal offset.
Define a reliable communication window.
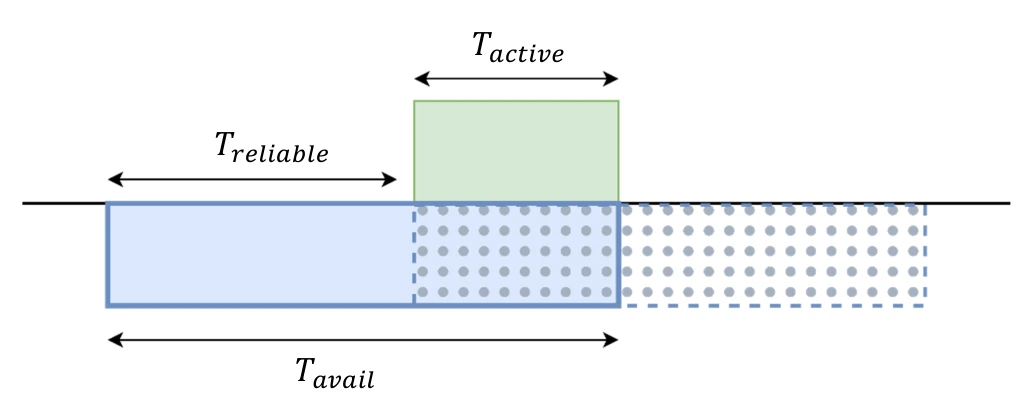
A UAV is only within range for a limited interval, and a duty-cycled sensor is active for only part of that time. The timing diagram explains why overlap determines successful communication.
Three time intervals. The device’s active interval must fit within the UAV’s available communication time. The reliable arrival window identifies timings that leave enough overlap to complete the exchange.
Connect timing to flight geometry.
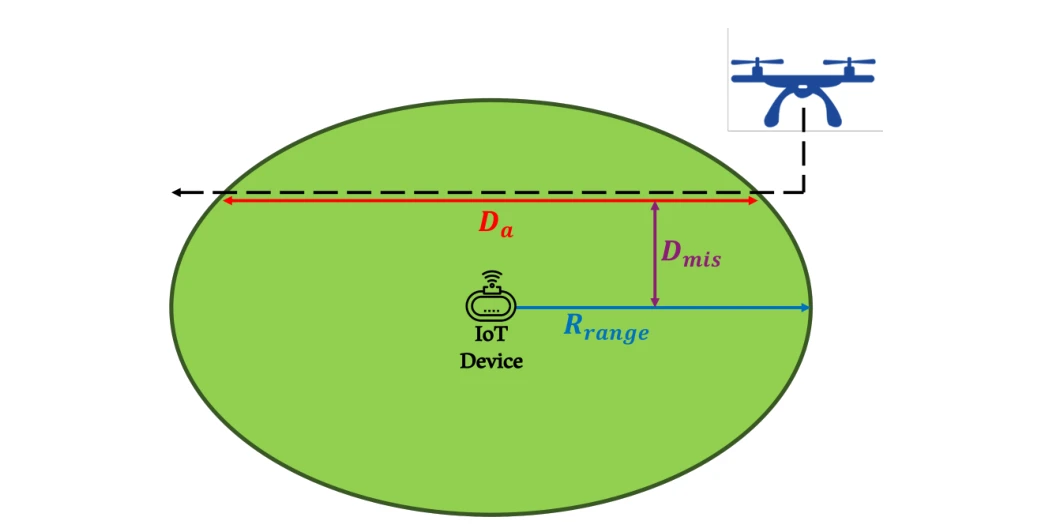
The path diagram relates UAV travel distance, radio range, and horizontal misalignment. It provides the geometry needed to translate speed into an available communication time.
Flight geometry. The path crosses the device’s communication disk with a horizontal offset. Increasing that offset shortens the traversed chord and therefore the available contact time at a fixed UAV speed.
Expose the lifetime–reliability tradeoff.
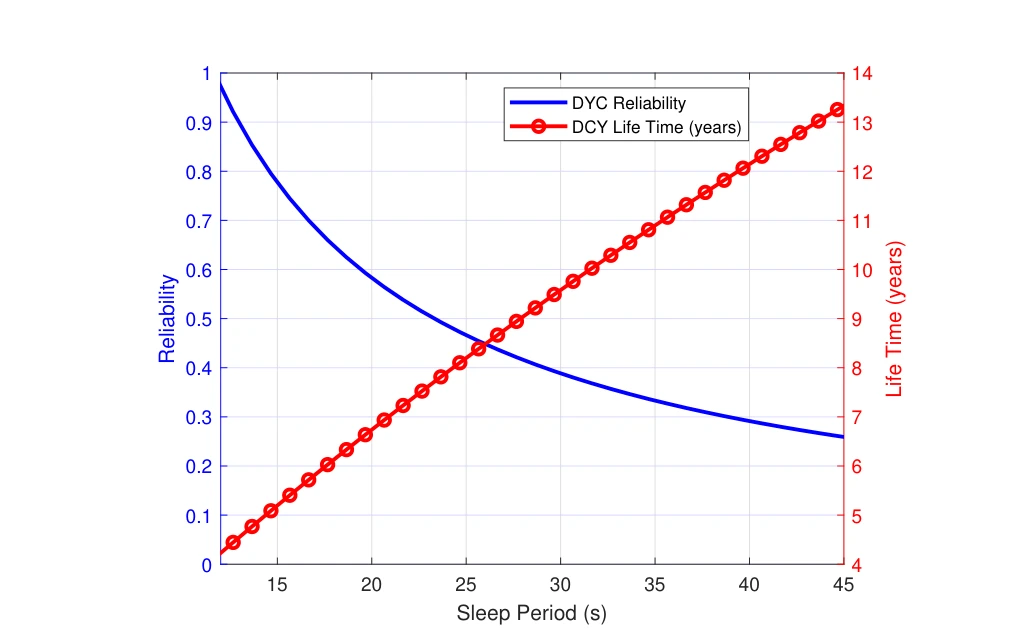
Increasing the sleep period extends battery life but reduces the chance that an ordinary duty-cycled node catches the UAV visit. The two curves make the competing effects visible.
Two vertical axes. The blue curve tracks communication reliability and the red curve battery lifetime as the duty-cycle sleep period increases. The same setting must be read against both outcomes.
The tradeoff. Longer sleep saves energy but increases the chance of missing the aircraft’s communication window. The plot therefore connects a battery-life benefit to a loss in timely availability.
See what faster flight changes.
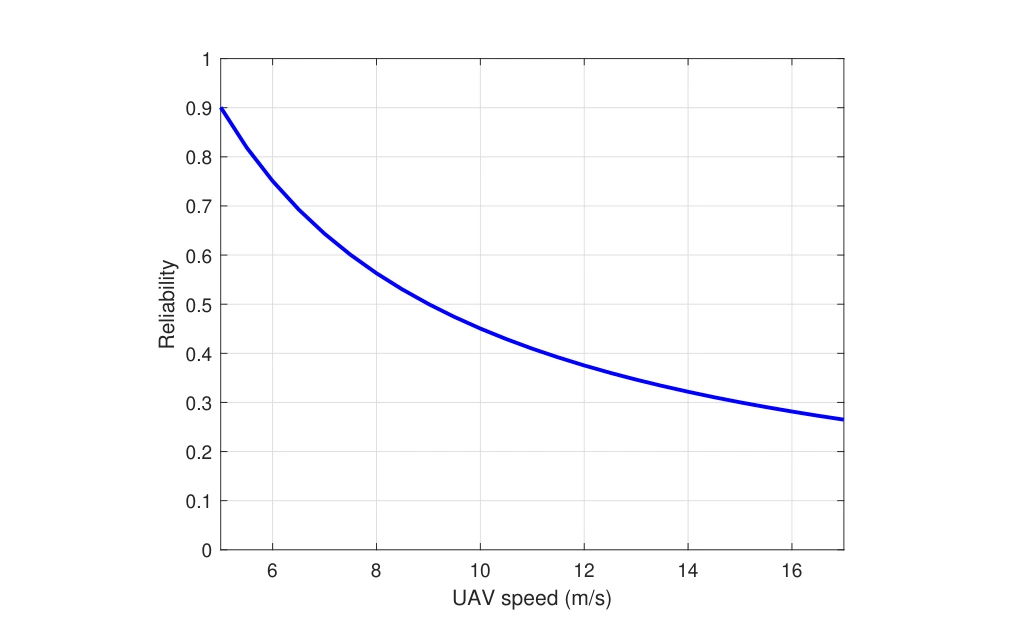
Communication reliability is plotted against UAV speed for the duty-cycled baseline. A shorter contact window makes missed visits more likely, motivating an on-demand wake-up mechanism.
What is held fixed. The plot varies UAV speed within the duty-cycled communication model. A faster aircraft spends less time within the device’s usable range, leaving fewer opportunities for a scheduled active interval to overlap.
How to read the result. The falling curve concerns successful communication during that contact window. It does not describe a change in the device’s radio sensitivity or the aircraft’s ability to transmit.
Scale the model to a sensor field.
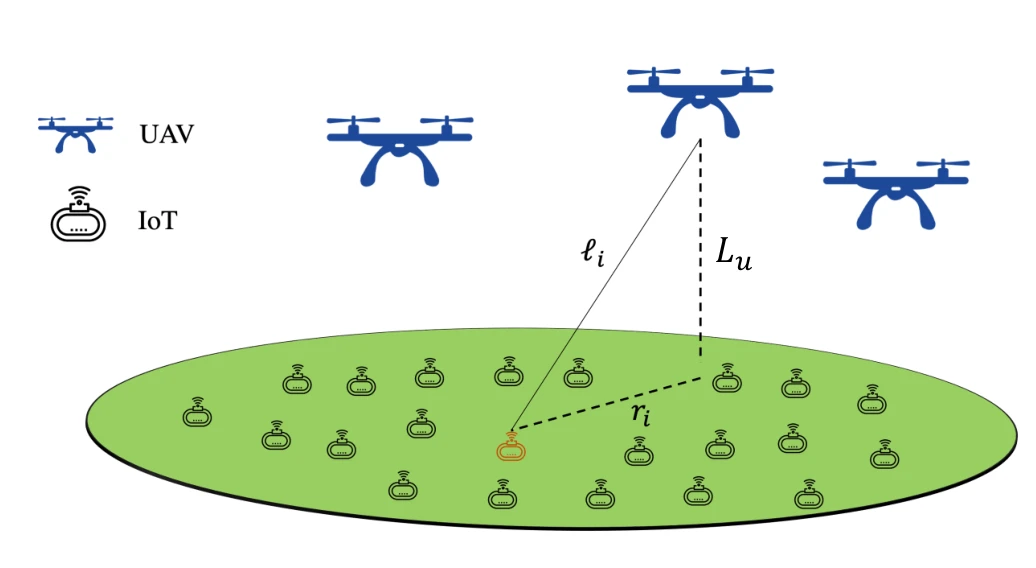
The system model expands from one UAV–sensor link to a spatial deployment. Altitude, distance, and the distribution of devices now become part of the analysis.
Spatial model. UAVs are placed above a field of IoT devices. The diagram distinguishes UAV altitude from the link distance to an individual ground node, which both enter the network geometry.
From one link to a field. The subsequent analysis averages over spatial realizations rather than assigning every device the same separation. This connects the prototype’s wake-up mechanism to probabilities of intended and unintended activation across a sensor field.
Construct a spatial network realization.
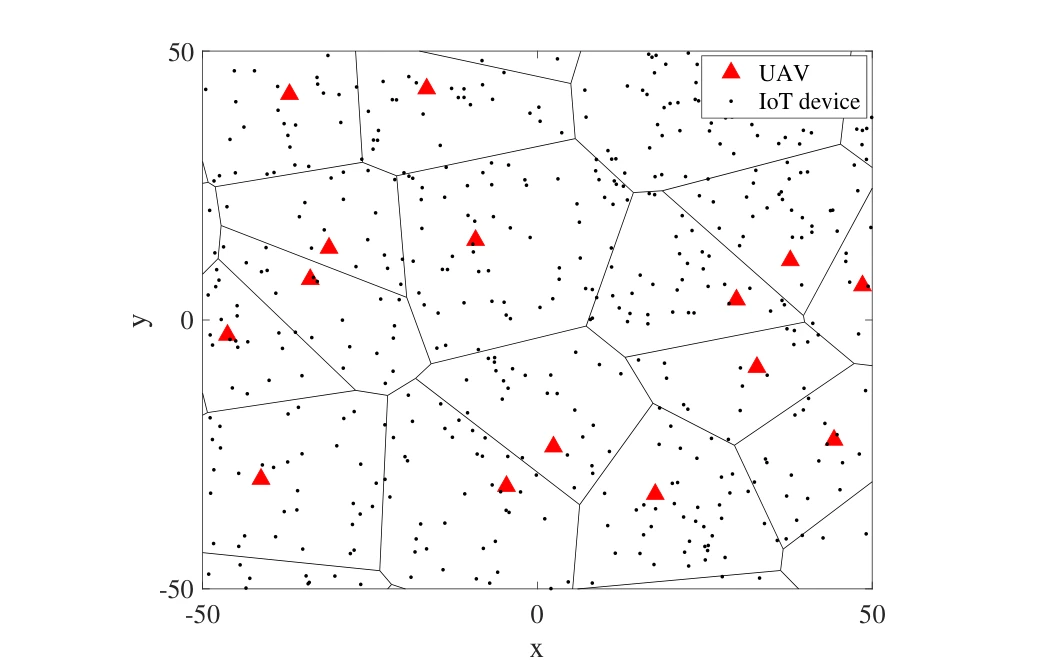
A sample field places UAVs and IoT nodes in a geometric setting. The realization illustrates the spatial assumptions used when evaluating wake-up and unintended wake-up events.
Symbols and cells. Triangles mark UAV locations and dots mark ground IoT devices. The Voronoi boundaries partition the sample field spatially, connecting an individual nearest-UAV relationship to the network model.
A spatial realization. The drawing is one realization of the assumed point processes at the stated UAV and IoT intensities. It supports the probability calculations that follow; it is not a map of a deployed agricultural site.
Choose a detection threshold.
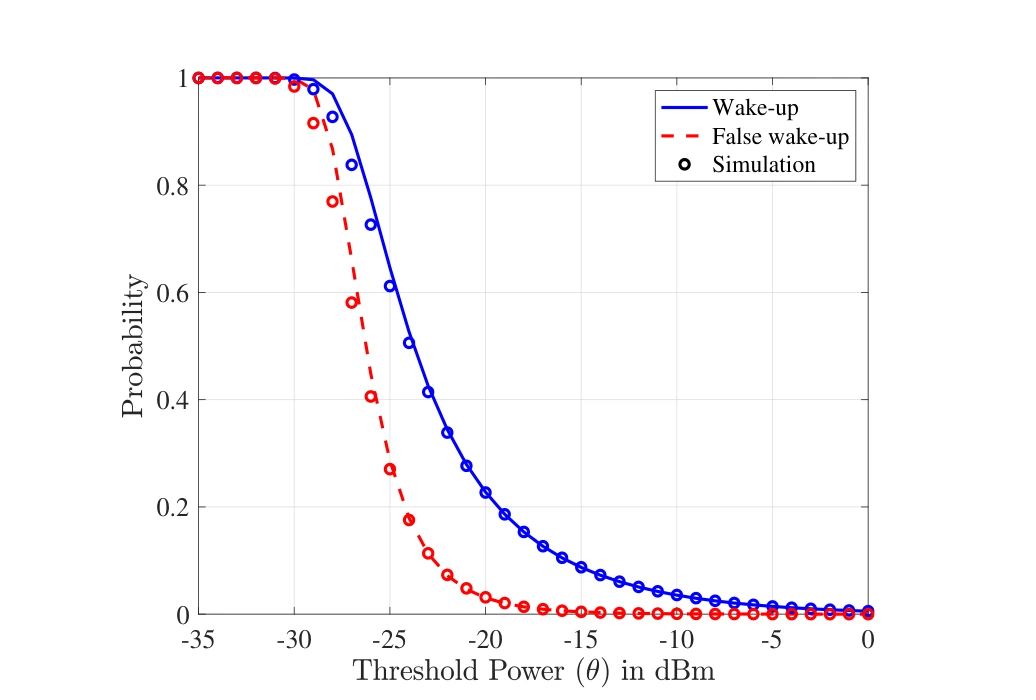
Wake-up and false wake-up probabilities respond differently to the threshold power. Simulation points provide a check on the analytical curves used to evaluate that tradeoff.
Two probabilities. The solid wake-up curve and dashed false-wake-up curve both vary with the receiver’s power threshold. Raising the threshold suppresses false activations, but also reduces the chance of detecting an intended wake-up.
Model and simulation. Simulation markers are overlaid on the analytical curves. Their comparison checks the network approximation, while the gap between the two probability curves exposes the threshold-selection tradeoff.
Study the effect of altitude.
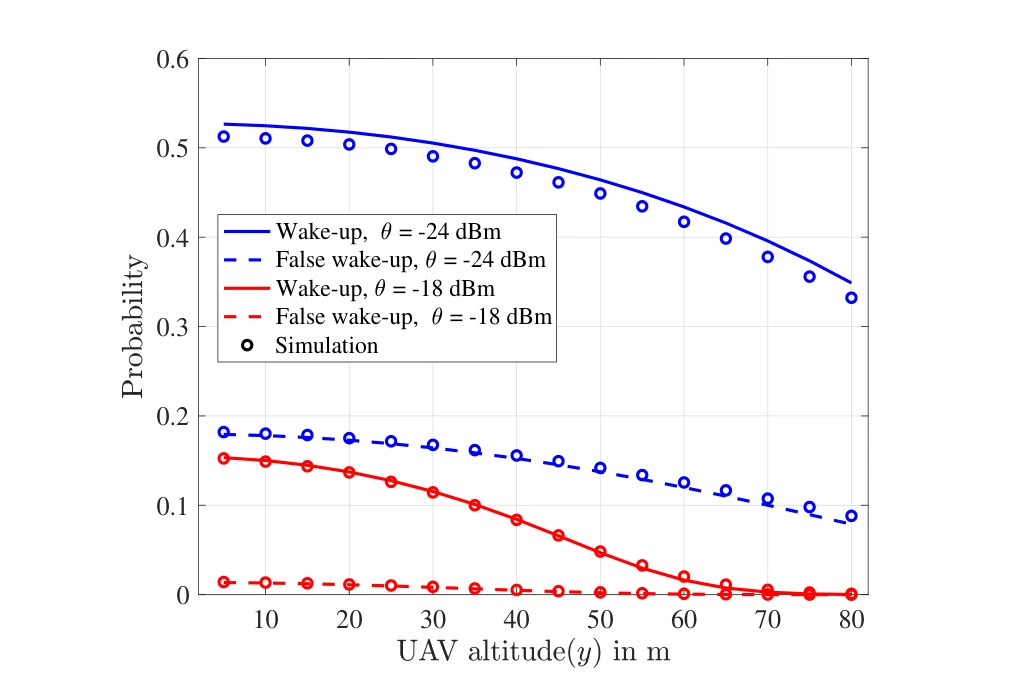
Changing UAV height alters both desired and unintended wake-up probabilities. Comparing thresholds shows why a deployment setting must consider more than communication range alone.
Across thresholds. The two threshold choices, −24 dBm and −18 dBm, give separate wake-up and false-wake-up curves. Comparing a threshold pair holds the receiver setting fixed while the UAV altitude changes.
Reading the tradeoff. Both probabilities tend to decrease with greater altitude in this model. Lower false-wake-up probability is therefore accompanied by weaker intended detection, rather than being a free improvement in selectivity.
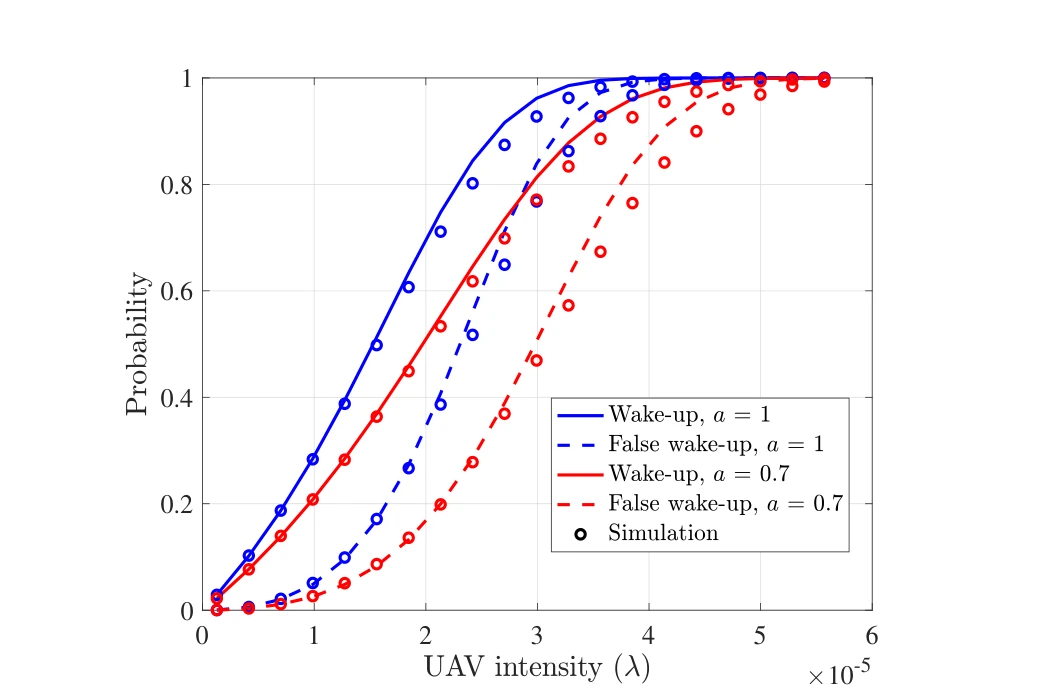
Study density and energy conversion together.
The final network-scale comparison varies UAV intensity and power-conversion efficiency. It connects local receiver behavior to the probability that a device is activated across a distributed deployment.
Across UAV densities. The horizontal axis varies the UAV point-process intensity. More nearby transmitters increase the opportunity for intended wake-up, but also increase the probability of unintended activation.
Across conversion efficiencies. Separate curve pairs use power-conversion coefficients of 1 and 0.7. Comparing them connects the network-level probabilities to receiver efficiency instead of treating the radio hardware as an ideal energy converter.
Putting it together
Connect the prototype to deployment decisions.
The figures build from circuit and board design to measured reach, timing constraints, and network-scale probabilities. That progression connects an implemented device to the tradeoffs needed for a larger aerial sensing system.
Citation
Khalifa, O., Mohammed, A. S., Alhejab, A., Abdelrahman, A. S., Al-Radhwan, A., Zhagypar, R., ElSawy, H., Kouzayha, N., Al-Harthi, N., Elmirghani, J., Aksoy, Z., & Al-Naffouri, T. Y. Energy-Efficient Aerial Data Aggregation for IoT: From Prototyping to Large-Scale Implementation. IEEE Transactions on Instrumentation and Measurement, 74, 1-18 (2025).
BibTeX
@article{khalifa2025aerial,
  title = {Energy-Efficient Aerial Data Aggregation for IoT: From Prototyping to Large-Scale Implementation},
  author = {Khalifa, Omar and Mohammed, Anas S. and Alhejab, Ali and Abdelrahman, Abdelrahman S. and Al-Radhwan, Ahmed and Zhagypar, Ruslan and ElSawy, Hesham and Kouzayha, Nour and Al-Harthi, Noha and Elmirghani, Jaafar and Aksoy, Zekeriya and Al-Naffouri, Tareq Y.},
  journal = {IEEE Transactions on Instrumentation and Measurement},
  volume = {74},
  pages = {1--18},
  year = {2025},
  doi = {10.1109/TIM.2024.3497061}
}