The question
How do randomly located defects affect the reliability of an increasingly small memristor? This conference paper begins with a spatial defect model, connects it to measured switching behavior, and follows the consequences of reducing area for monolayer and multilayer devices.
Start with a spatial model of defects.
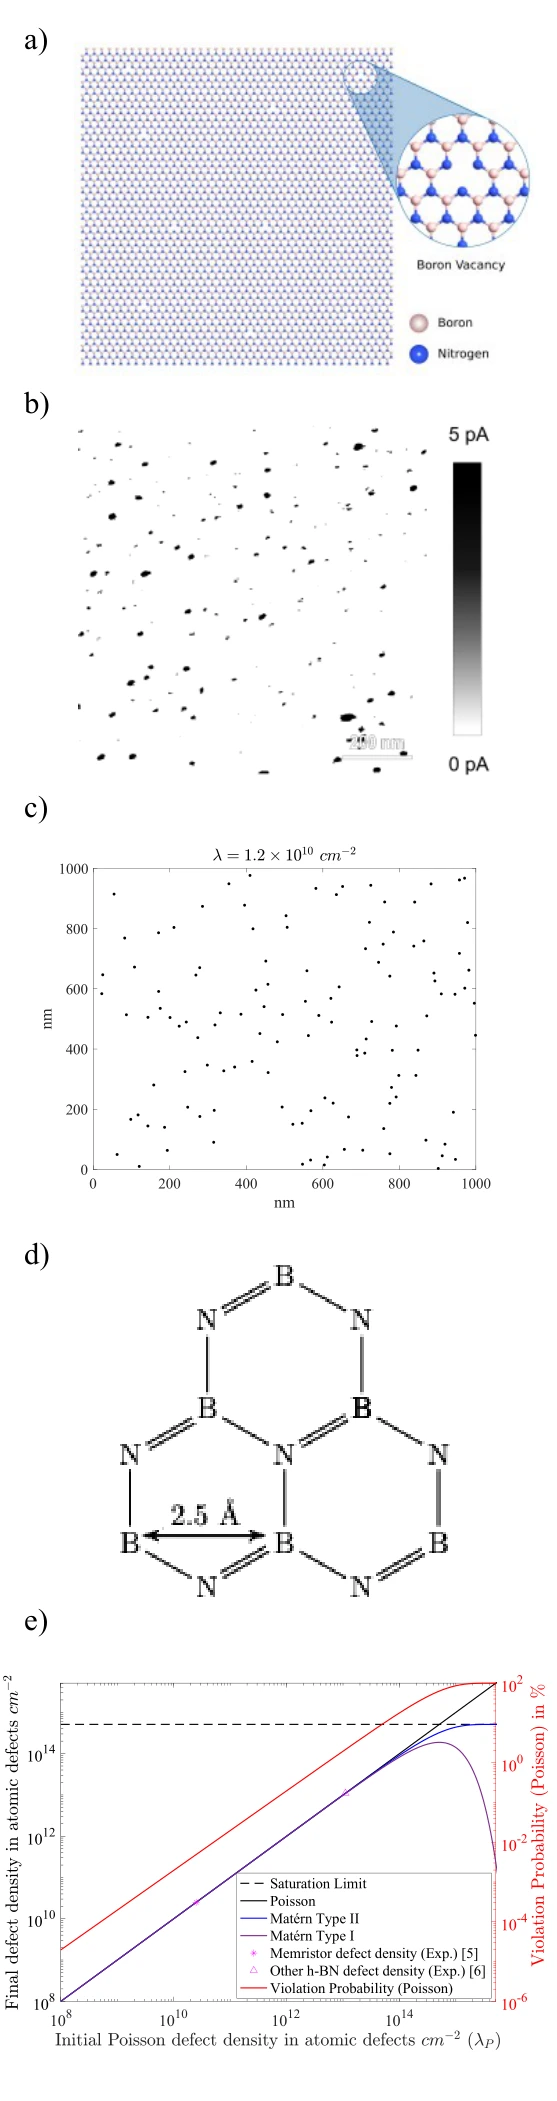
The schematic, microscopy example, and stochastic realization introduce the physical origin of switching sites. The modeling steps connect the distribution of those sites to the probability of obtaining an operational device.
Panels (a) and (b). The defect schematic and conductive-AFM image motivate a spatial model: switching-relevant sites are distributed across the material, rather than guaranteed to appear in the same place in every device.
Panels (c) and (d). The point-process realization is a mathematical representation of those locations. The lattice drawing adds the atomic-scale constraint that neighboring vacancy sites cannot be arbitrarily close together.
Panel (e). The density plot compares the Poisson model with two hard-core processes and a saturation limit. Its second axis tracks the Poisson model’s distance-constraint violations. This explains where a convenient random-placement model needs a physical correction.
Relate intrinsic yield to density and area.
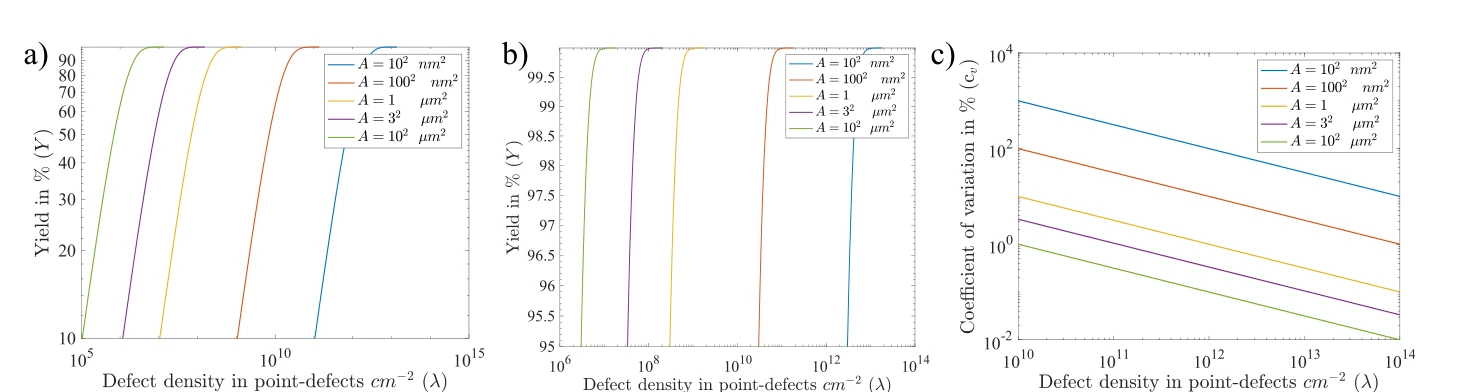
A smaller device contains fewer possible switching sites. These curves show how the intrinsic yield and its variability change with both defect density and device area, including the high-yield regime.
Panels (a)–(c). The yield sweep, high-yield enlargement, and coefficient of variation separate the probability of having defects from variability between device realizations.
Check monolayer switching predictions.
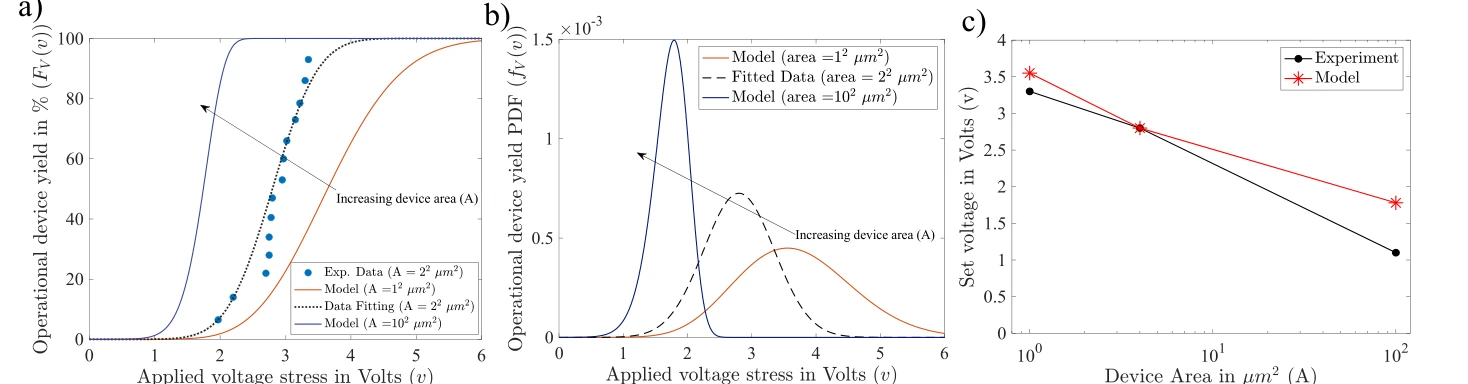
Area-dependent switching-voltage curves are fitted to reported monolayer measurements and then extrapolated. The comparison connects the spatial defect model to an experimentally measurable operating quantity.
Panels (a)–(c). Operational yield is converted into a voltage distribution, then compared with measured switching voltage across device areas. This tests voltage predictions as well as yield.
Move to multilayer devices.
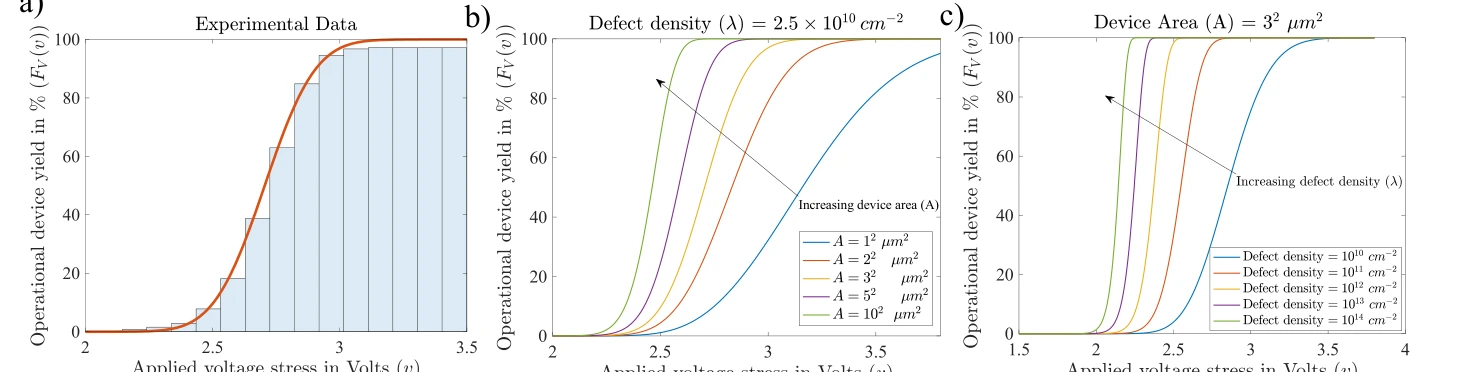
The multilayer case uses measured voltage-dependent yield to calibrate the model. Predicted curves then examine how changes in defect density and device area shift the operational response.
Panels (a)–(c). Measured multilayer-device statistics establish the fit. Subsequent model sweeps change device area and defect density separately to expose their distinct effects.
Expose the variability tradeoff.
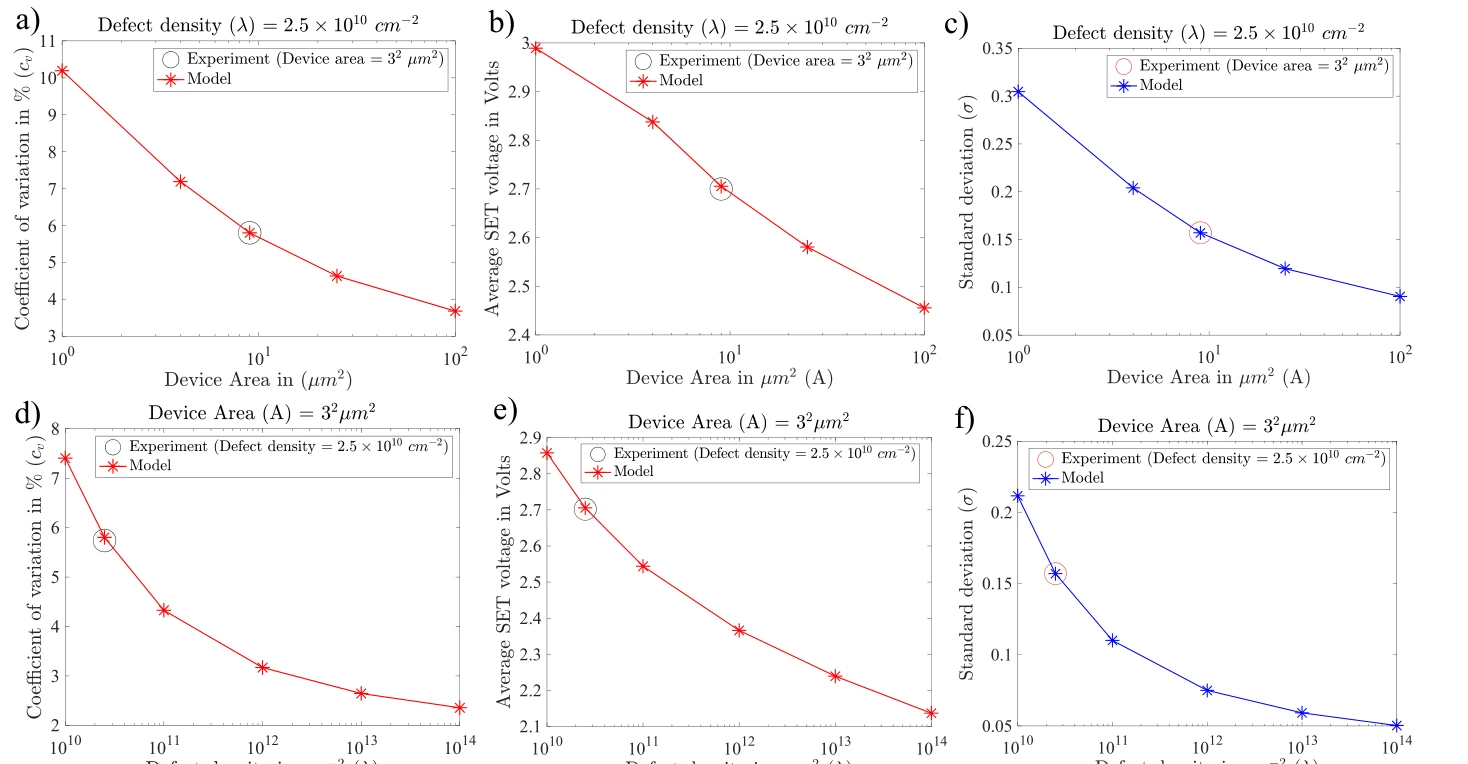
The final panels bring together variation, average SET voltage, and standard deviation across area scales. Reading them together shows why a high switching yield alone is not a complete measure of device quality.
Panels (a)–(c). Coefficient of variation, mean SET voltage, and standard deviation are plotted against device area. The three measures distinguish relative spread from the absolute voltage scale.
Panels (d)–(f). The same quantities are then plotted against defect density at fixed area. Comparing the two rows shows why improving one variability measure cannot be interpreted without the corresponding voltage and geometry.
Putting it together
An initial step toward defect-aware scaling.
The conference study makes yield and variability part of the same scaling problem. The later defect-aware framework develops this direction into a broader bottom-up description.
Citation
Abdelrahman, A. S., ElSawy, H., Lanza, M., Akinwande, D., & Al-Dirini, F. Scalability of h-BN Based Memristors: Yield and Variability Considerations. Silicon Nanoelectronics Workshop (2023).
BibTeX
@inproceedings{abdelrahman2023scalability,
  title = {Scalability of h-BN Based Memristors: Yield and Variability Considerations},
  author = {Abdelrahman, Abdelrahman S. and ElSawy, Hesham and Lanza, Mario and Akinwande, Deji and Al-Dirini, Feras},
  booktitle = {2023 Silicon Nanoelectronics Workshop (SNW)},
  year = {2023},
  doi = {10.23919/SNW57900.2023.10183973}
}