The question
Making a switching layer thinner does not remove the randomness of its defects. This paper builds a framework from defect statistics upward, then checks device-level predictions and explores what changes at extreme miniaturization. Its figures connect atomic structure to manufacturing-relevant behavior.
Connect defects, materials, and devices.
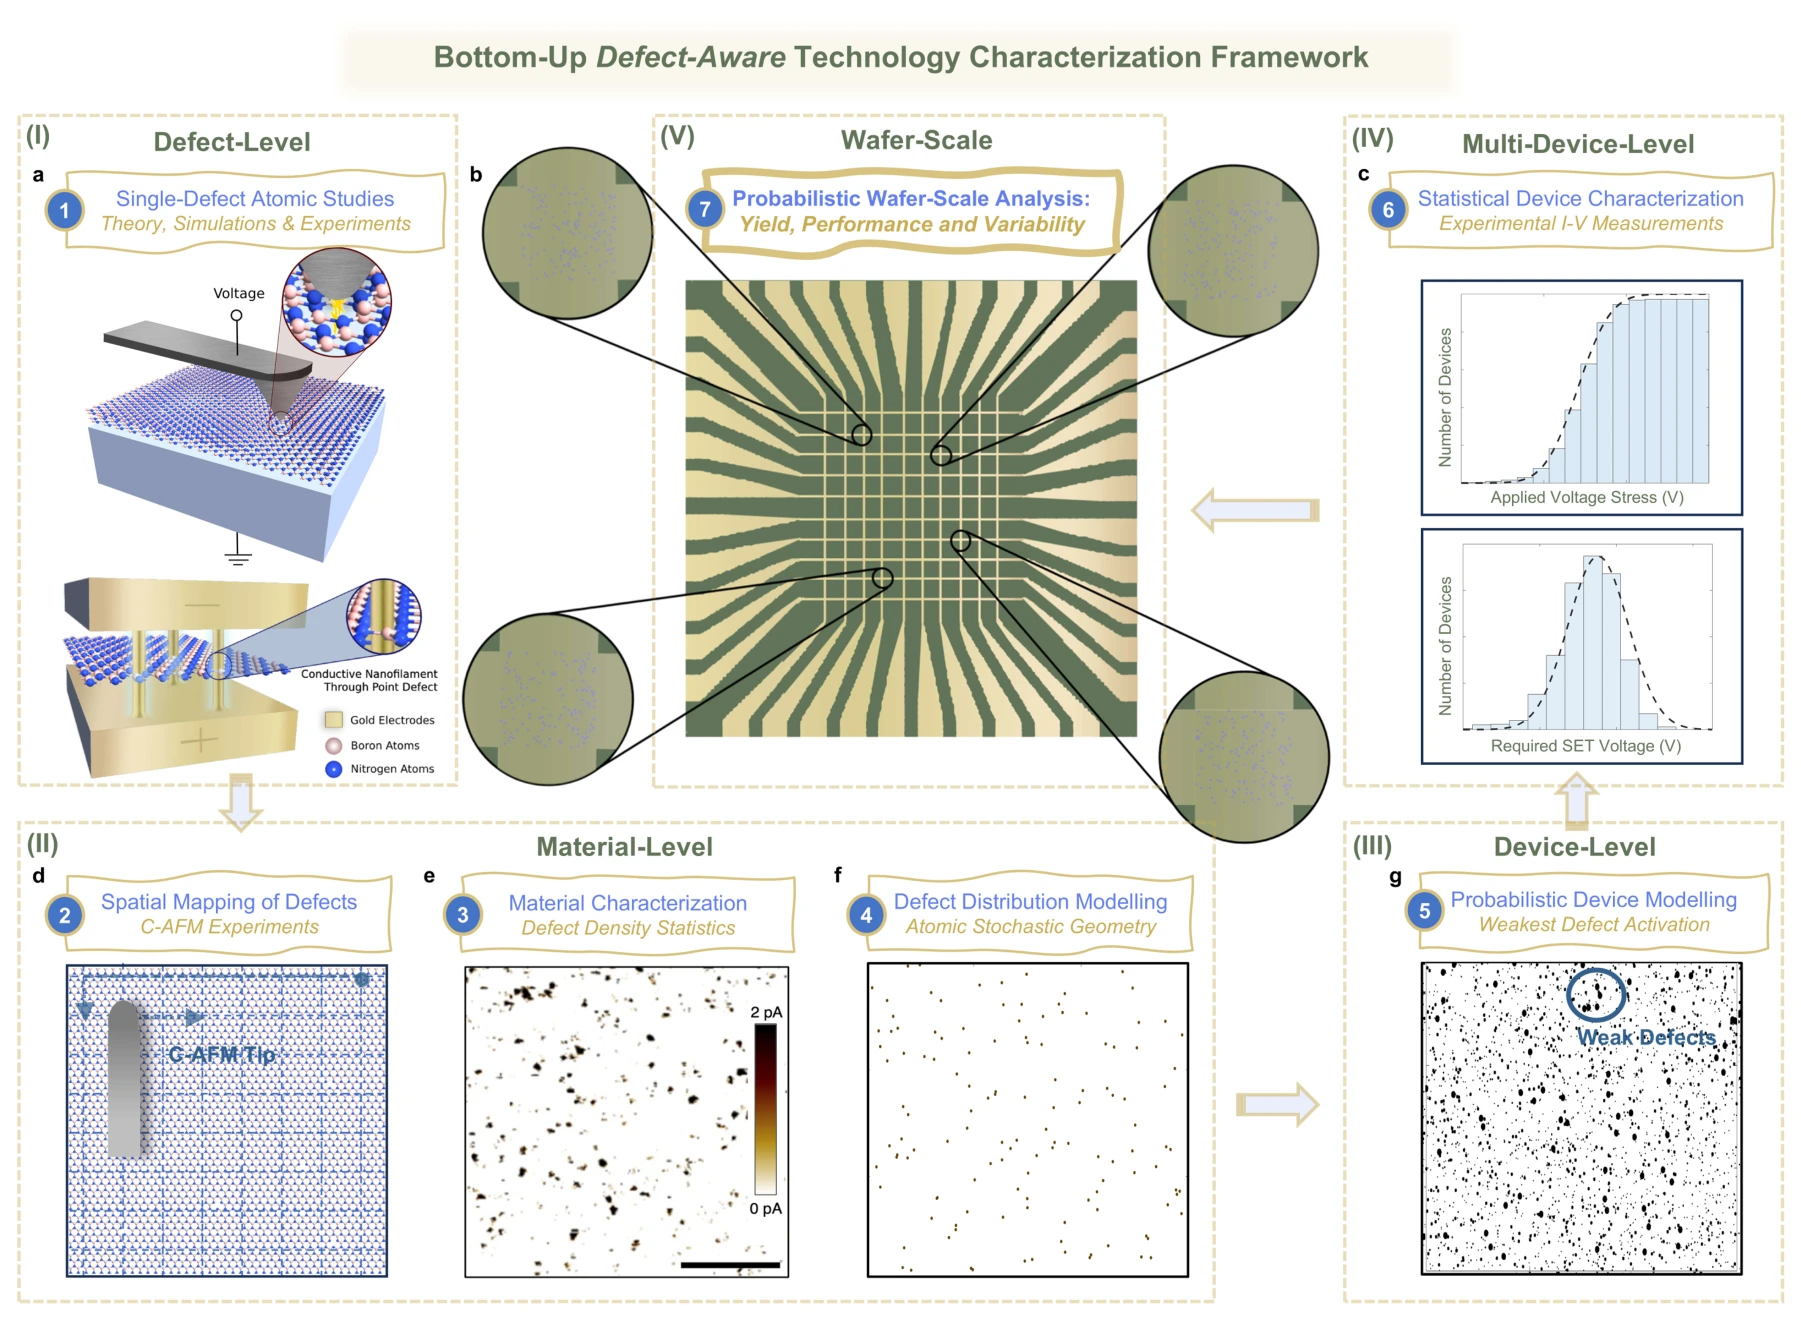
The framework moves through several levels of description: individual defect behavior, spatial material statistics, and the response of a complete device. This organization links microscopic assumptions to quantities such as yield and operating voltage.
Panel (a) and panels (d)–(f). The framework starts with an individual defect and a switching structure, then moves to microscopy and spatial maps of many defects. The material model connects atom-scale information to a statistical description of the film.
Panels (g) and (c). The device model assigns switching behavior to a realization of defects. Measurements across multiple devices then constrain its statistical parameters; the displayed yield data represent a device population, rather than a single switching trace.
Panel (b). The crossbar illustration is the final scale of the framework. Devices within an array can contain different defect realizations, so predictions of yield and variability must carry the underlying stochastic model through to the array level.
Represent atomic defects statistically.
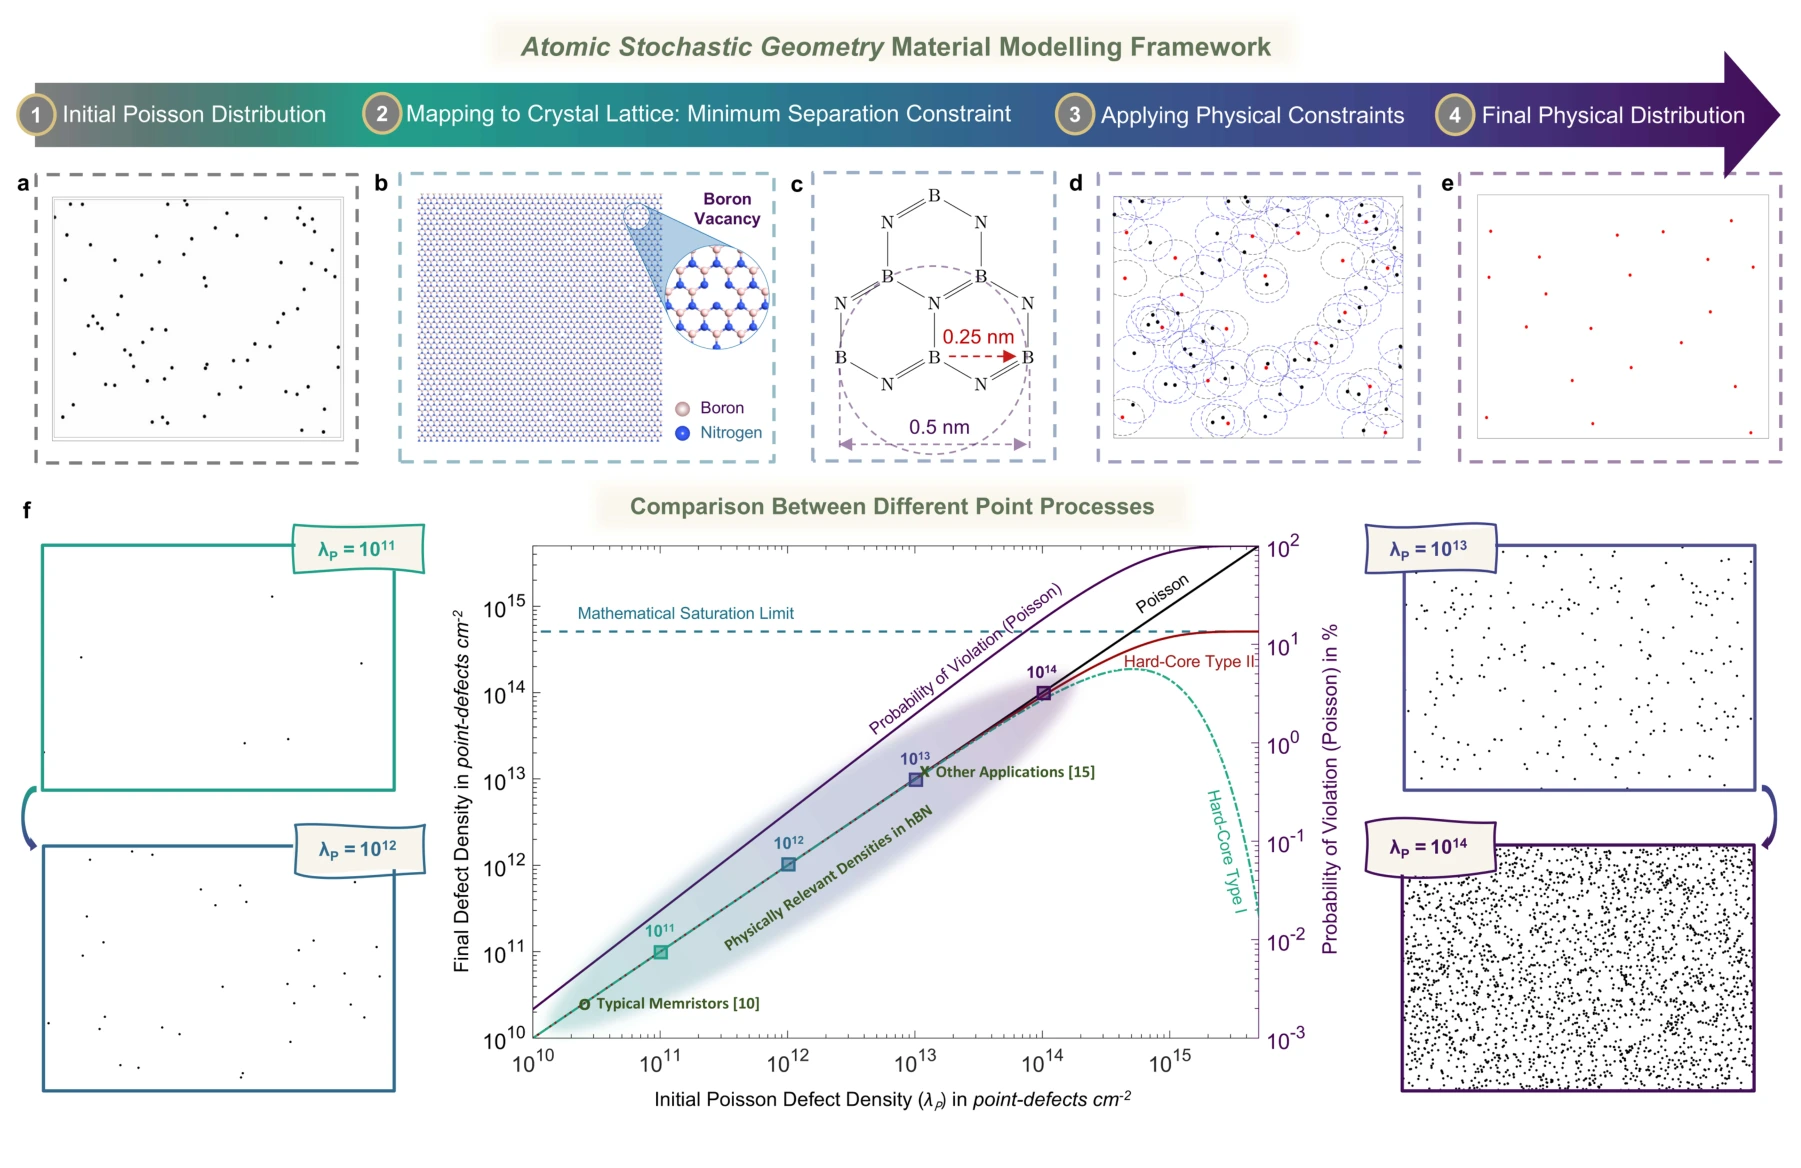
Poisson and hard-core point processes describe different spatial assumptions about defects. Comparing these models shows when exclusion distances matter and how physically constrained defect distributions differ from unconstrained random placement.
Panels (a)–(c). A Poisson point process supplies a starting spatial model, while the h-BN lattice introduces a minimum separation between admissible vacancy locations. An unconstrained random placement need not respect that atomic distance.
Panels (d) and (e). The hard-core construction removes points that violate the separation rule. Black points in the construction are removed; retained red points form the constrained realization shown separately in the next panel.
Panel (f). The density comparison shows how the Poisson and hard-core models diverge as defects become crowded. The saturation bound and constraint-violation probability identify when an unconstrained spatial approximation becomes physically problematic.
Predict monolayer device behavior.
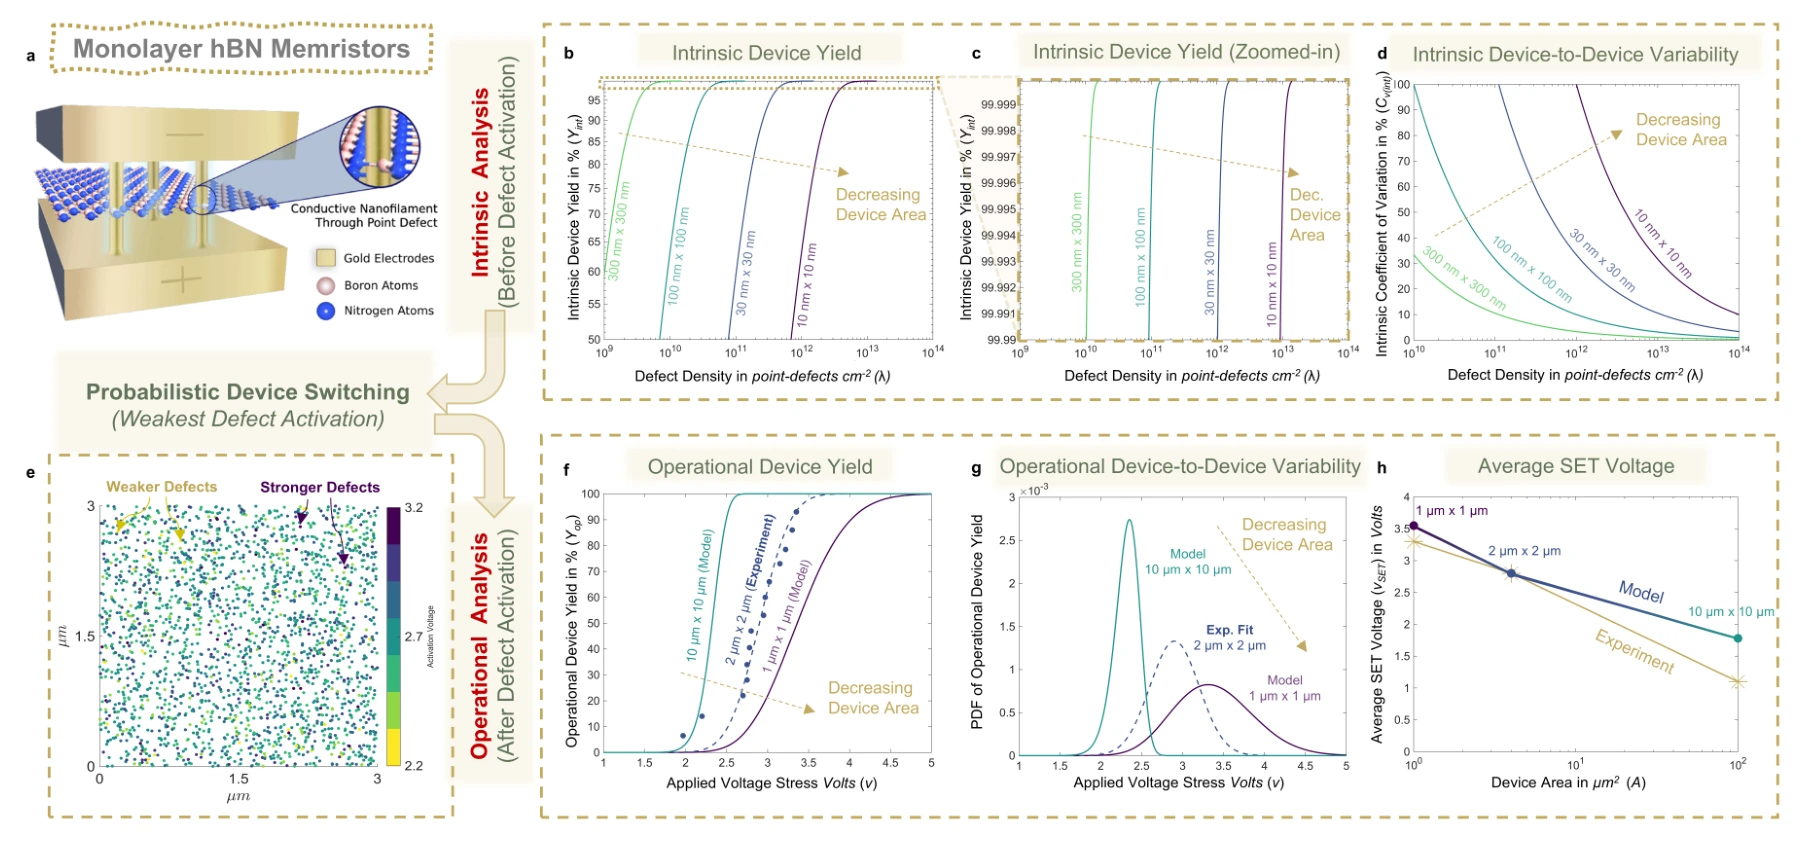
The model connects device area and defect density to intrinsic yield, switching-voltage distributions, and variability in monolayer h-BN memristors. Experimental comparisons provide a check on the statistical predictions.
Panels (a)–(e). The device schematic and defect realization connect the material model to intrinsic yield and variability. Area and defect density control how many potential switching sites a device contains.
Panels (f)–(h). Applied-voltage yield curves become switching-voltage distributions and an area-dependent voltage prediction. Experimental points provide the comparison for the probabilistic device model.
Extend the model to multilayer devices.
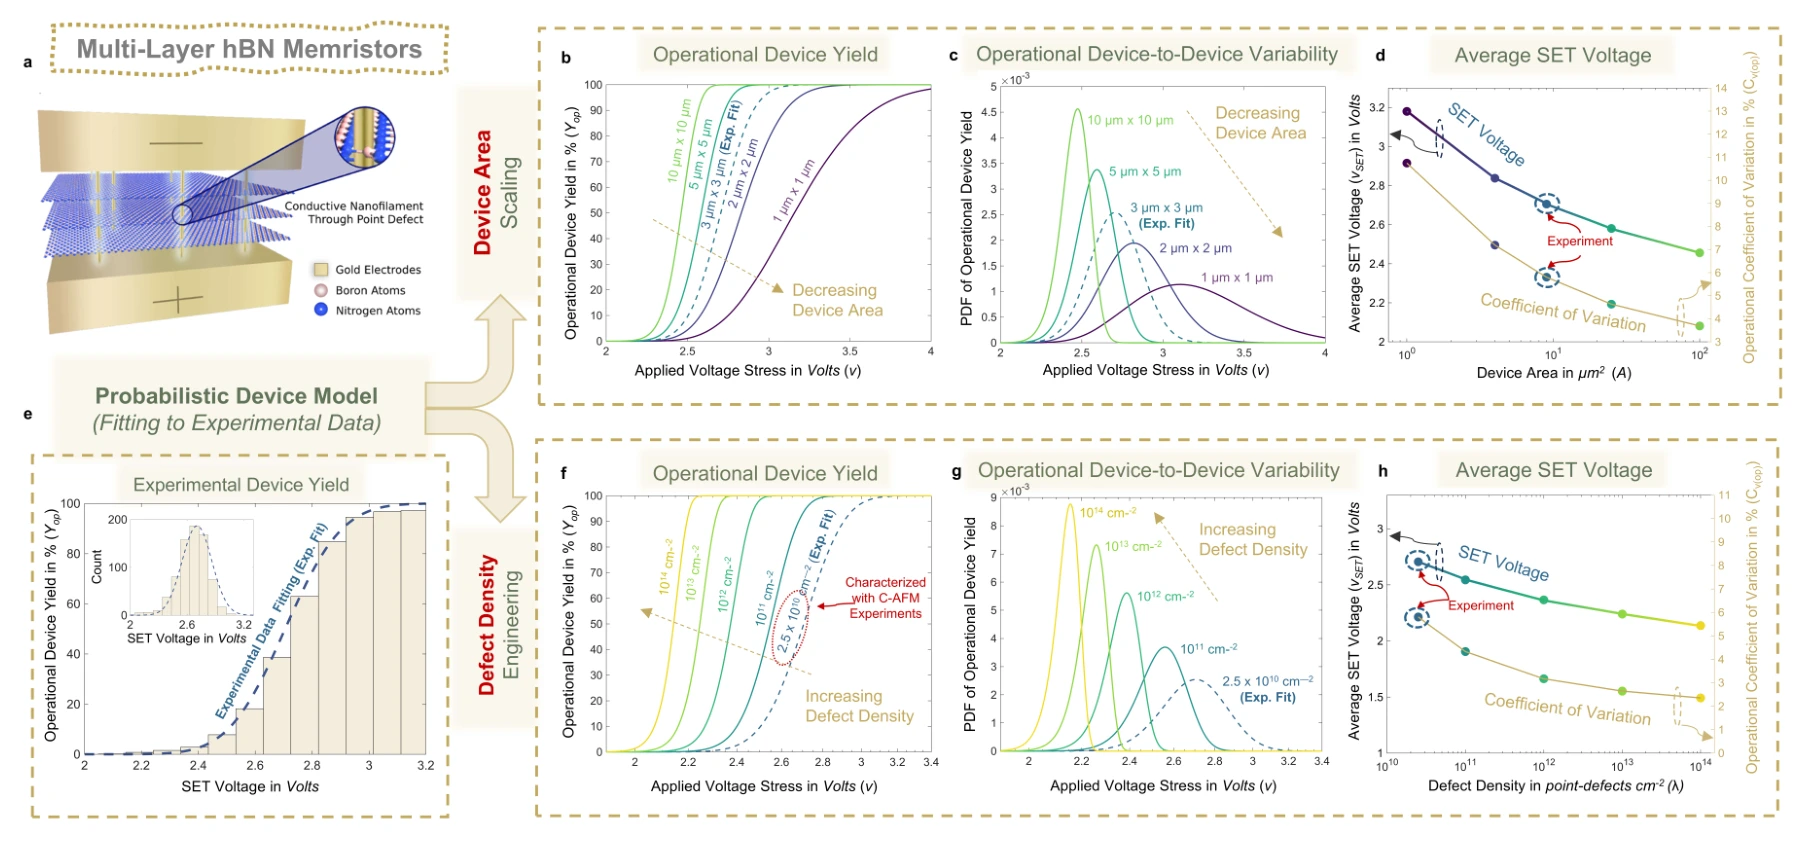
A multilayer switching path changes which defects must participate in conduction. The figure applies the framework to multilayer h-BN devices and compares area-dependent predictions with measured switching behavior.
Panels (a)–(d). The multilayer switching structure is followed by area-dependent yield curves, voltage distributions, and voltage/variability summaries at fixed defect density.
Panels (e)–(h). Measured switching statistics anchor the model. Holding area fixed while changing defect density then separates a material-distribution effect from the device-area sweep above.
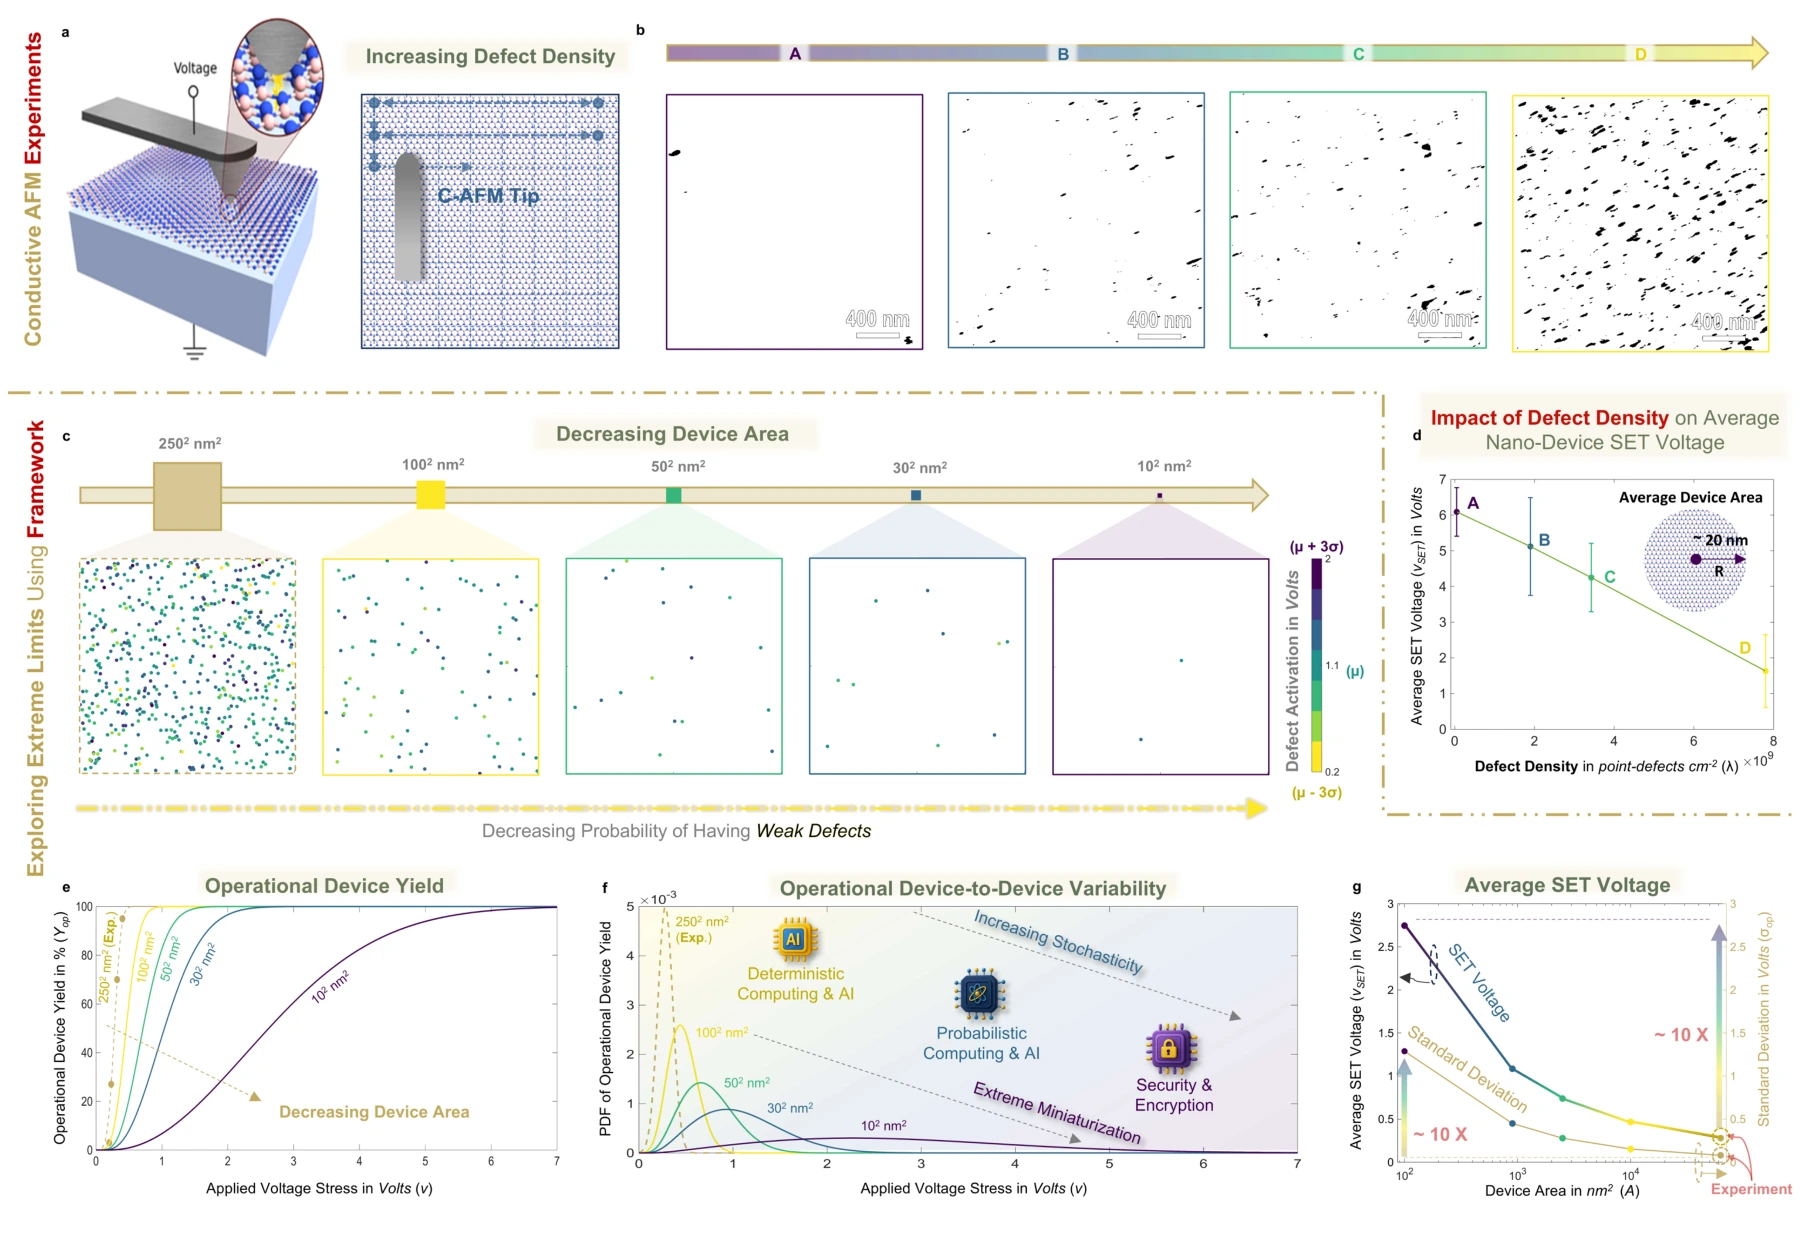
Examine extreme miniaturization.
Nanoscale characterization and model extrapolations probe the consequences of reducing device area. The results distinguish a device being able to switch from it doing so with favorable voltage and device-to-device variability.
Panels (a), (b), and (d). Conductive-AFM measurements connect nanoscale switching voltages to films with different measured defect densities. The current maps are thresholded to make individual defects visible; the voltage plot includes experimental variability.
Panel (c). The spatial realizations shrink the device area while marking defects by their activation voltage. Smaller devices contain fewer candidate switching sites, so different defect realizations can lead to different device responses.
Panels (e)–(g). Operational-yield curves are translated into switching-voltage distributions and then into mean voltage and standard deviation. Reading all three separates the chance of switching from the spread of voltages among devices.
Putting it together
Scaling needs a statistical description.
The same defect population influences yield, voltage, and variability in different ways. Evaluating those quantities together makes the tradeoffs of miniaturization more explicit than a dimensional scaling argument alone.
Citation
Abdelrahman, A. S., ElSawy, H., Yuan, Y., Cheema, S. S., Akinwande, D., Lanza, M., & Al-Dirini, F. Defect-Aware Extreme Device Scaling Limits of 2D Memristive Technologies. Research Square (2025). https://doi.org/10.21203/rs.3.rs-7265912/v1
BibTeX
@misc{abdelrahman2025defect,
  title = {Defect-Aware Extreme Device Scaling Limits of 2D Memristive Technologies},
  author = {Abdelrahman, Abdelrahman S. and ElSawy, Hesham and Yuan, Yue and Cheema, Suraj S. and Akinwande, Deji and Lanza, Mario and Al-Dirini, Feras},
  year = {2025},
  publisher = {Research Square},
  doi = {10.21203/rs.3.rs-7265912/v1},
  url = {https://www.researchsquare.com/article/rs-7265912/v1}
}